

Question: QUESTION NUMBER 2. USING MATLAB Use MATLAB to solve each problem Some of the commands you may need on this assignment are: syms, fplot, diff
QUESTION NUMBER 2. USING MATLAB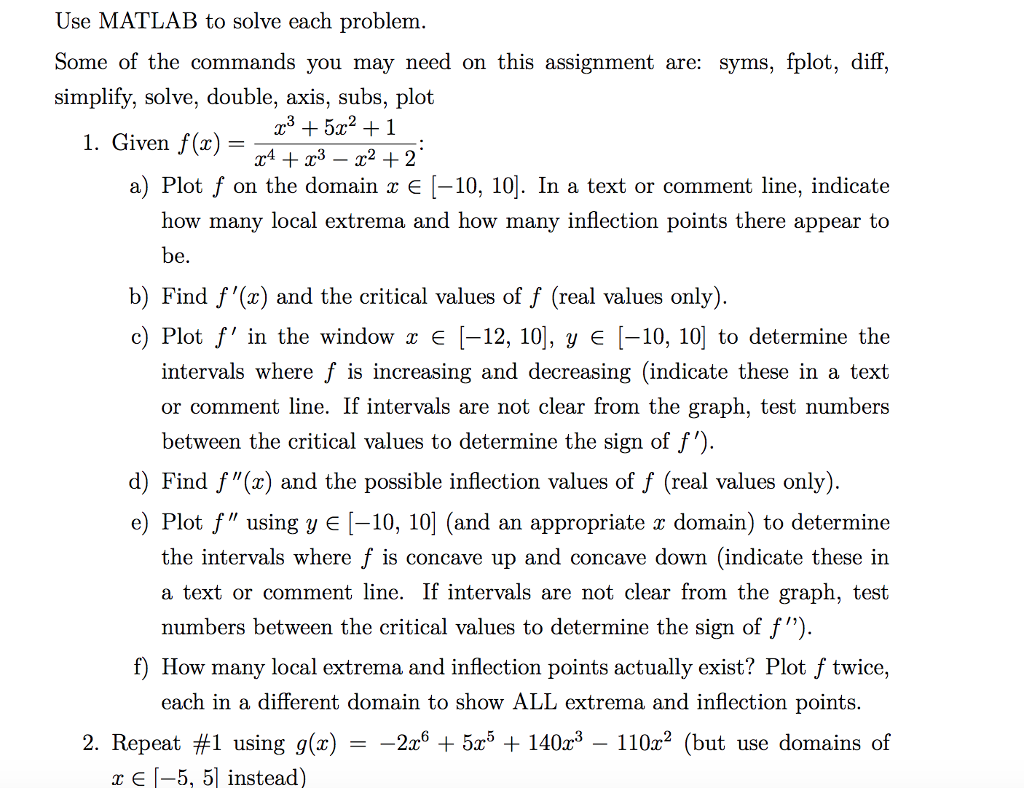
Use MATLAB to solve each problem Some of the commands you may need on this assignment are: syms, fplot, diff simplify, solve, double, axis, subs, plot 1. Given f(x)- a) Plot f on the domain x [-10, 10]. In a text or comment line, indicate how many local extrema and how many inflection points there appear to b) Find f'(x) and the critical values of f (real values only) c) Plot f' in the window x -12, 10], y -10, 10 to determine the intervals where f is increasing and decreasing (indicate these in a text or comment line. If intervals are not clear from the graph, test numbers between the critical values to determine the sign of f') d) Find f"(x) and the possible inflection values of f (real values only) e) Plot f" using y E [-10, 10] (and an appropriate x domain) to determine the intervals where f is concave up and concave down (indicate these in a text or comment line. If intervals are not clear from the graph, test numbers between the critical values to determine the sign of f" How many local extrema and inflection points actually exist? Plot f twice, each in a different domain to show ALL extrema and inflection points. 2. Repeat #1 using g(x)--2x6 + 5x5 + 140x3-110x2 (but use domains of r E[-5, 5 instead) Use MATLAB to solve each problem Some of the commands you may need on this assignment are: syms, fplot, diff simplify, solve, double, axis, subs, plot 1. Given f(x)- a) Plot f on the domain x [-10, 10]. In a text or comment line, indicate how many local extrema and how many inflection points there appear to b) Find f'(x) and the critical values of f (real values only) c) Plot f' in the window x -12, 10], y -10, 10 to determine the intervals where f is increasing and decreasing (indicate these in a text or comment line. If intervals are not clear from the graph, test numbers between the critical values to determine the sign of f') d) Find f"(x) and the possible inflection values of f (real values only) e) Plot f" using y E [-10, 10] (and an appropriate x domain) to determine the intervals where f is concave up and concave down (indicate these in a text or comment line. If intervals are not clear from the graph, test numbers between the critical values to determine the sign of f" How many local extrema and inflection points actually exist? Plot f twice, each in a different domain to show ALL extrema and inflection points. 2. Repeat #1 using g(x)--2x6 + 5x5 + 140x3-110x2 (but use domains of r E[-5, 5 instead)
Step by Step Solution
There are 3 Steps involved in it

Get step-by-step solutions from verified subject matter experts