

Question: Question on running times of insertion and selection sort, plotting them on graph and timing them. Write an insertion sort function and a selection sort
Question on running times of insertion and selection sort, plotting them on graph and timing them.
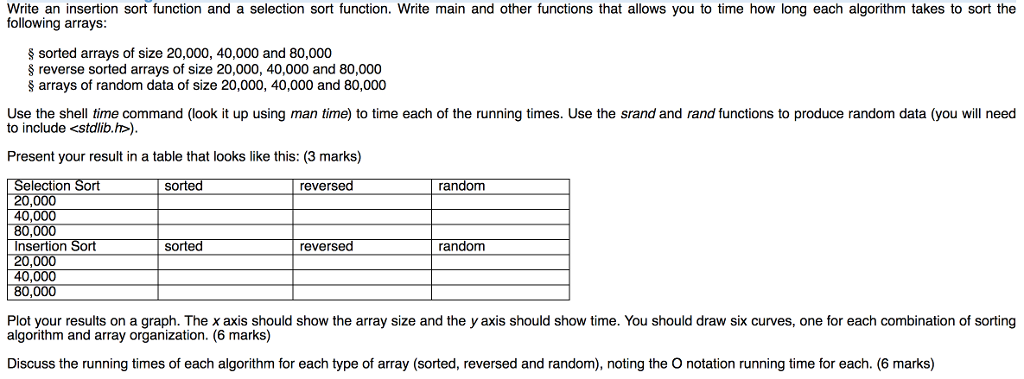
Write an insertion sort function and a selection sort function. Write main and other functions that allows you to time how long each algorithm takes to sort the following arrays: sorted arrays of size 20,000, 40,000 and 80,000 reverse sorted arrays of size 20,000, 40,000 and 80,000 arrays of random data of size 20,000, 40,000 and 80,000 Use the shell time command (look it up using man time) to time each of the running times. Use the srand and rand functions to produce random data (you will need to include ). Present your result in a table that looks like this: Plot your results on a graph. The x axis should show the array size and the y axis should show time. You should draw six curves, one for each combination of sorting algorithm and array organization. Discuss the running times of each algorithm for each type of array (sorted, reversed and random), noting the O notation running time for each
Step by Step Solution
There are 3 Steps involved in it

Get step-by-step solutions from verified subject matter experts