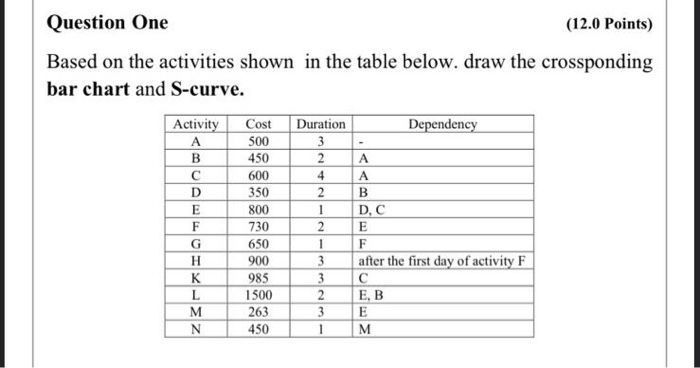
Question: Question One (12.0 Points) Based on the activities shown in the table below. draw the crossponding bar chart and S-curve. Activity Cost Duration Dependency 500

Question One (12.0 Points) Based on the
Question One (12.0 Points) Based on the activities shown in the table below. draw the crossponding bar chart and S-curve. Activity Cost Duration Dependency 500 3 450 2 600 A B 800 D C 730 E 650 F 900 3 after the first day of activity F 985 3 1500 2 E B 263 3 E 450 M melal 350 2 A B D E F G H K L M N 1

Step by Step Solution

There are 3 Steps involved in it

1 Expert Approved Answer
Step: 1 Unlock blur-text-image
Question Has Been Solved by an Expert!

Get step-by-step solutions from verified subject matter experts

Step: 2 Unlock
Step: 3 Unlock

Students Have Also Explored These Related General Management Questions!