

Question: Question one: Statistical Modeling Analysis (13 points) CLO1 For the following question and based on the below Regression and Surface reports as well as the
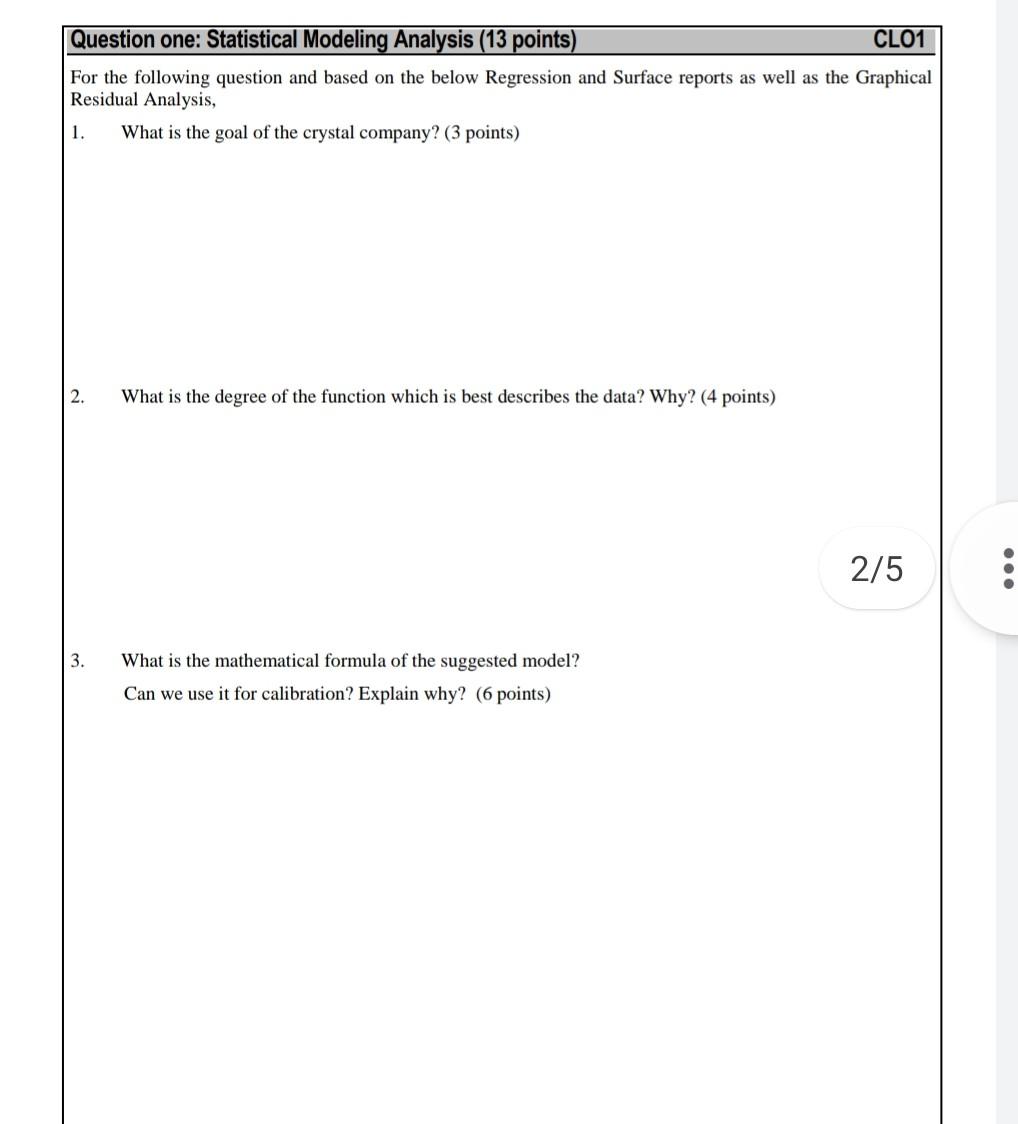
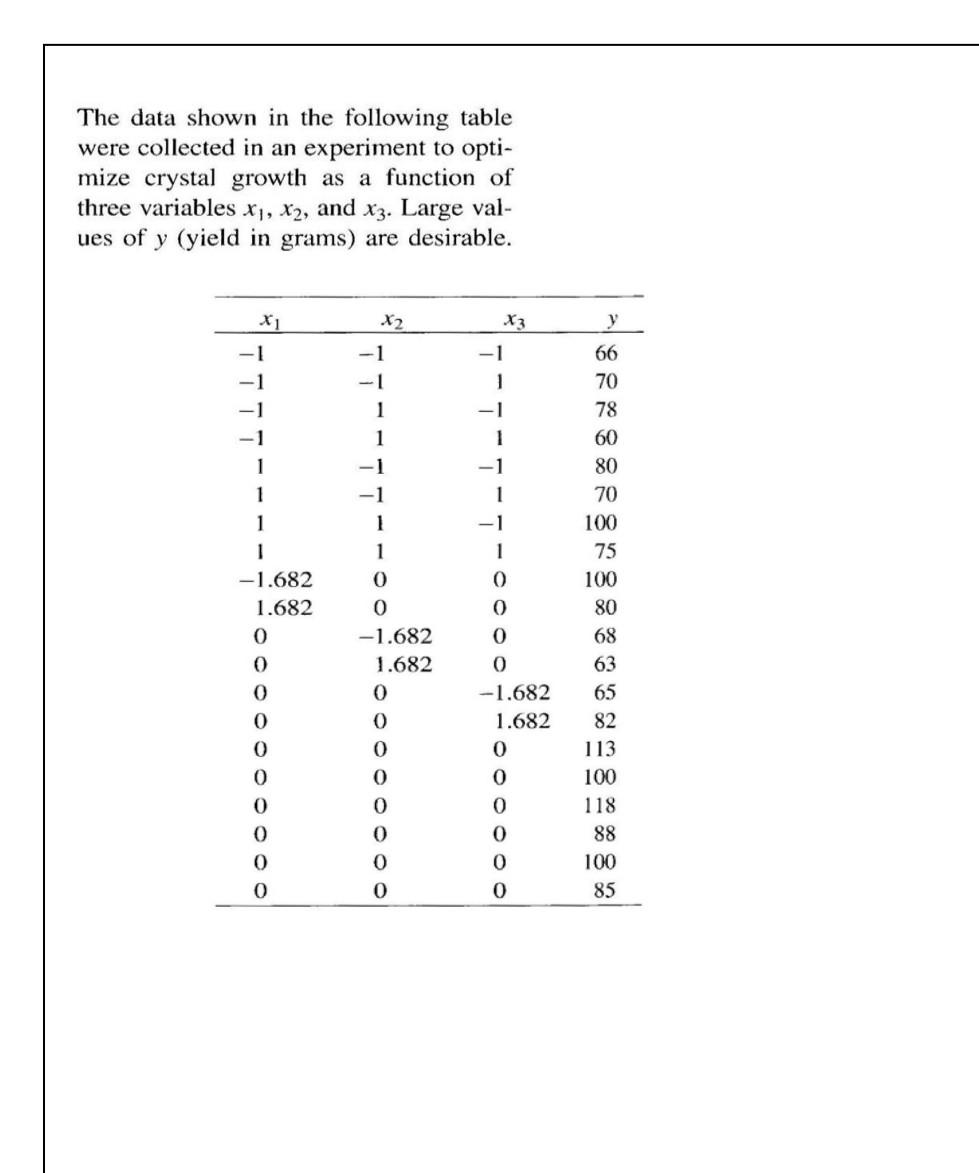
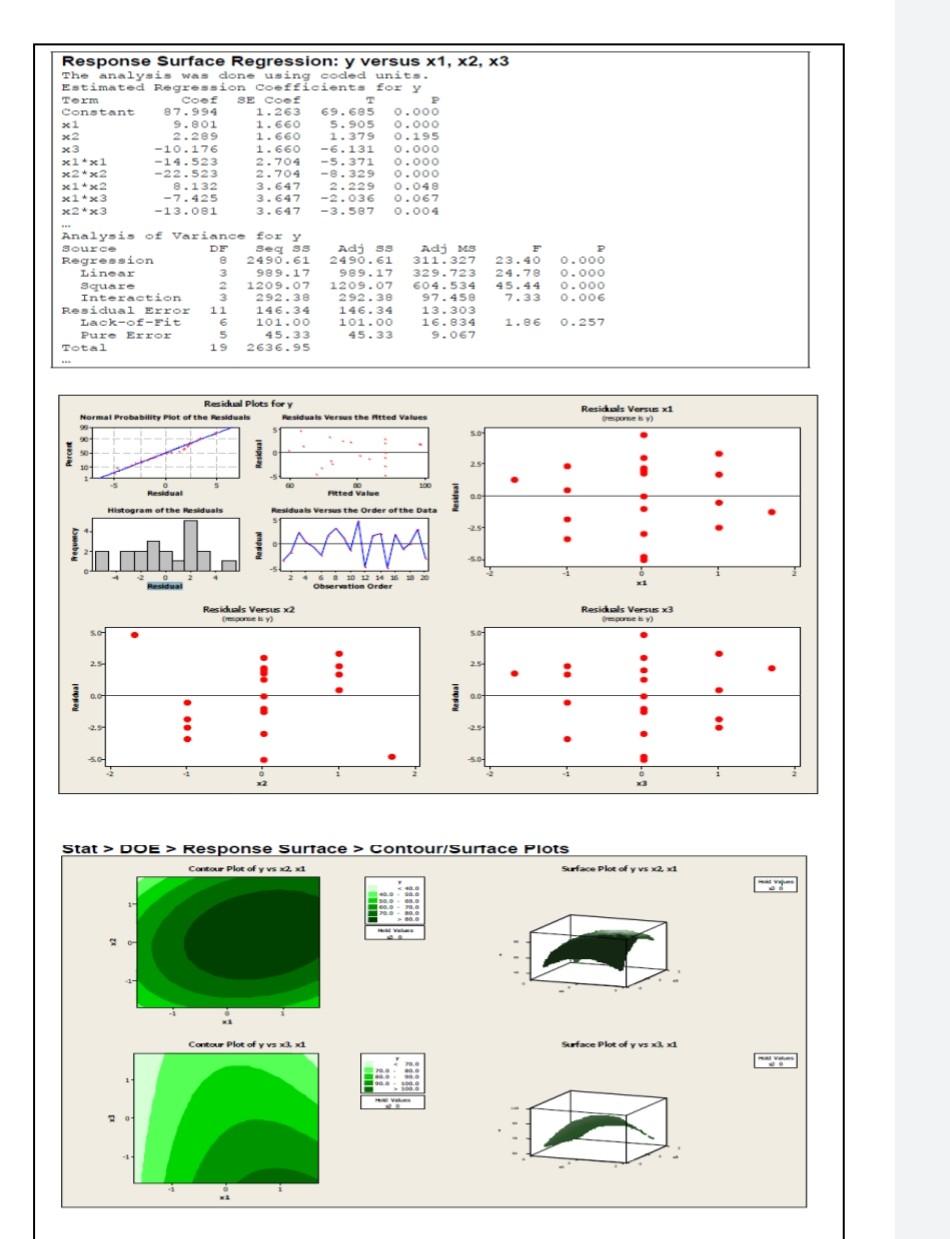
Question one: Statistical Modeling Analysis (13 points) CLO1 For the following question and based on the below Regression and Surface reports as well as the Graphical Residual Analysis, 1. What is the goal of the crystal company? (3 points) 2. What is the degree of the function which is best describes the data? Why? (4 points) 2/5 : 3. What is the mathematical formula of the suggested model? Can we use it for calibration? Explain why? (6 points) The data shown in the following table were collected in an experiment to opti- mize crystal growth as a function of three variables x1, x2, and X3. Large val- ues of y (yield in grams) are desirable. X] .X2 X3 -1 - 1 -1 1 -1 y 66 70 78 60 80 70 100 75 100 80 68 63 65 82 1 1 1 -1.682 1.682 o 0 0 0 1 0 0 1 0 0 -1.682 1.682 0 0 0 O O -1.682 1.682 0 0 113 0 0 0 0 0 0 0 0 0 100 118 88 100 85 O 0 0 Response Surface Regression: y versus x1, x2, x3 The analysis was done using coded units. Estimated Regression coefficients for y Torm Coof SE Coos P Constant 87.994 1.263 69.685 0.000 x2 9.801 1.660 5.905 0.000 x2 2.289 1.660 1.379 0.195 x3 -10.176 1.660 -6.131 0.000 x1 * x1 -14.523 2.704 -5.371 0.000 x2 * x2 -22.523 2.704 -8.329 0.000 x1 * x2 8.132 3.647 2.229 0.048 x1 * x3 -7.425 3.647 -2.036 0.067 x2 * x3 -13.081 3.647 -3.587 0.004 Analysis of Variance for y Source DE Seg 35 Regression 2490.61 Linear 3 989.17 Square 3 1209.07 Interaction 3 292.38 Residual Error 11 146.34 Lack-of-Fit 6 101.00 Pure Error 5 45.33 Total 19 2636.95 Ady 33 2490.61 989.17 1209.07 292.38 146.34 101.00 45.33 Adjes 311.327 329.723 604.534 97.450 13.303 16.834 9.067 F 23.40 24.78 45.44 7.33 0.000 0.000 0.000 0.006 1.86 0.257 Resicul Plots for y Normal Probability Plot of the Residuals Residuals Ver the nitted Values Residuls Versus xd 1 251 : 10 Fitted value Resitat Histogram of the residuals Residuals Versus the Order of the Data 25 02 Residual 2 10 3 16 2 Observation Order Resides Versus x2 Residuals Versus X3 2.5 . Real 0.0 Resdal 1 .... 25+ 21 : 54 Stat > DOE > Response Surface > Contour/Surface Piots Contour Plot of y vs 2 x1 Surface Plot of yvs x2 Cantor Plot of y va Surface Plot of yw dd 1 Question one: Statistical Modeling Analysis (13 points) CLO1 For the following question and based on the below Regression and Surface reports as well as the Graphical Residual Analysis, 1. What is the goal of the crystal company? (3 points) 2. What is the degree of the function which is best describes the data? Why? (4 points) 2/5 : 3. What is the mathematical formula of the suggested model? Can we use it for calibration? Explain why? (6 points) The data shown in the following table were collected in an experiment to opti- mize crystal growth as a function of three variables x1, x2, and X3. Large val- ues of y (yield in grams) are desirable. X] .X2 X3 -1 - 1 -1 1 -1 y 66 70 78 60 80 70 100 75 100 80 68 63 65 82 1 1 1 -1.682 1.682 o 0 0 0 1 0 0 1 0 0 -1.682 1.682 0 0 0 O O -1.682 1.682 0 0 113 0 0 0 0 0 0 0 0 0 100 118 88 100 85 O 0 0 Response Surface Regression: y versus x1, x2, x3 The analysis was done using coded units. Estimated Regression coefficients for y Torm Coof SE Coos P Constant 87.994 1.263 69.685 0.000 x2 9.801 1.660 5.905 0.000 x2 2.289 1.660 1.379 0.195 x3 -10.176 1.660 -6.131 0.000 x1 * x1 -14.523 2.704 -5.371 0.000 x2 * x2 -22.523 2.704 -8.329 0.000 x1 * x2 8.132 3.647 2.229 0.048 x1 * x3 -7.425 3.647 -2.036 0.067 x2 * x3 -13.081 3.647 -3.587 0.004 Analysis of Variance for y Source DE Seg 35 Regression 2490.61 Linear 3 989.17 Square 3 1209.07 Interaction 3 292.38 Residual Error 11 146.34 Lack-of-Fit 6 101.00 Pure Error 5 45.33 Total 19 2636.95 Ady 33 2490.61 989.17 1209.07 292.38 146.34 101.00 45.33 Adjes 311.327 329.723 604.534 97.450 13.303 16.834 9.067 F 23.40 24.78 45.44 7.33 0.000 0.000 0.000 0.006 1.86 0.257 Resicul Plots for y Normal Probability Plot of the Residuals Residuals Ver the nitted Values Residuls Versus xd 1 251 : 10 Fitted value Resitat Histogram of the residuals Residuals Versus the Order of the Data 25 02 Residual 2 10 3 16 2 Observation Order Resides Versus x2 Residuals Versus X3 2.5 . Real 0.0 Resdal 1 .... 25+ 21 : 54 Stat > DOE > Response Surface > Contour/Surface Piots Contour Plot of y vs 2 x1 Surface Plot of yvs x2 Cantor Plot of y va Surface Plot of yw dd 1
Step by Step Solution
There are 3 Steps involved in it
1 Expert Approved Answer
Step: 1 Unlock

Question Has Been Solved by an Expert!
Get step-by-step solutions from verified subject matter experts
Step: 2 Unlock
Step: 3 Unlock