

Question: question P-14-9 data question P14-10 question P14-11 question p14-12 question P14-14 question P14-15 question p 14-16 Save TIITICWIN. Ulapter 14 Homework Score: 0 of 1
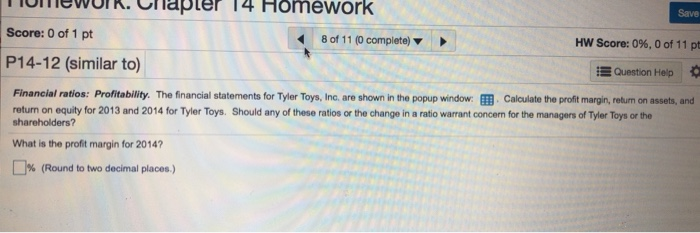
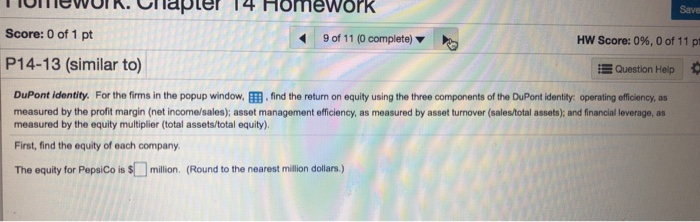
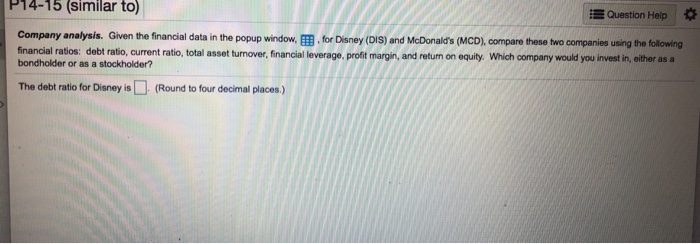
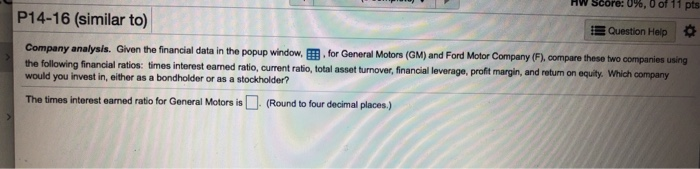
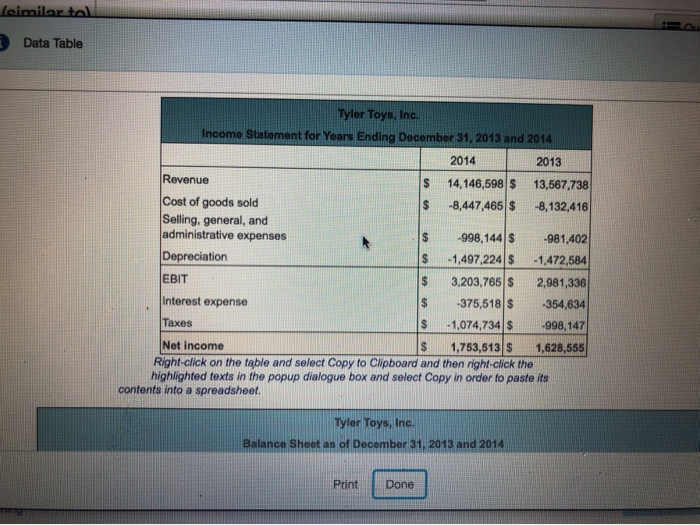
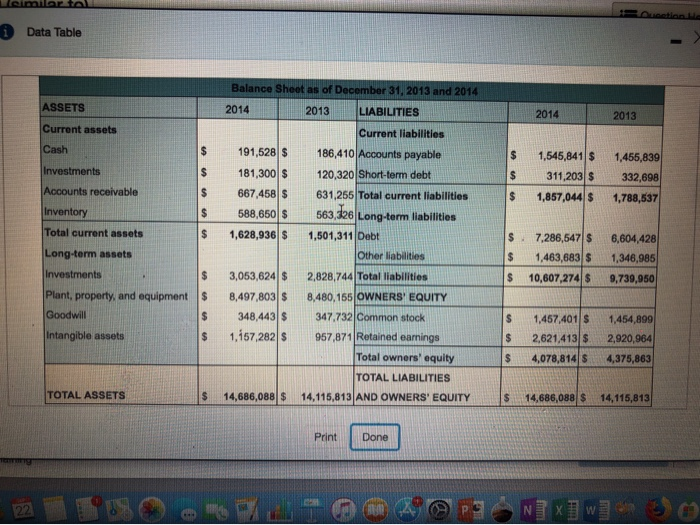
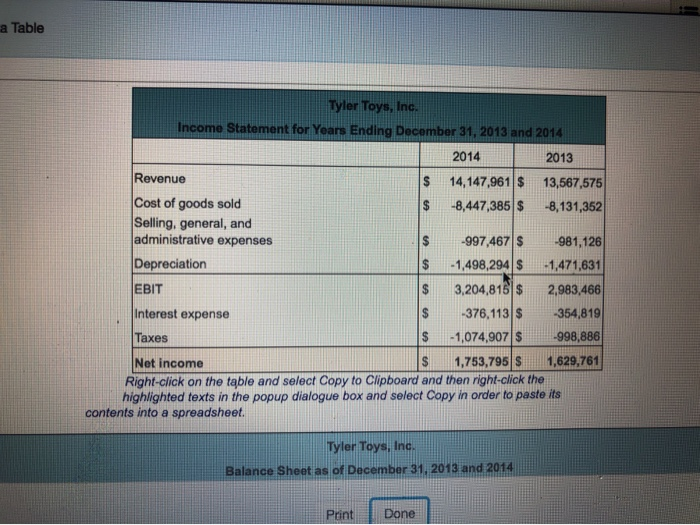
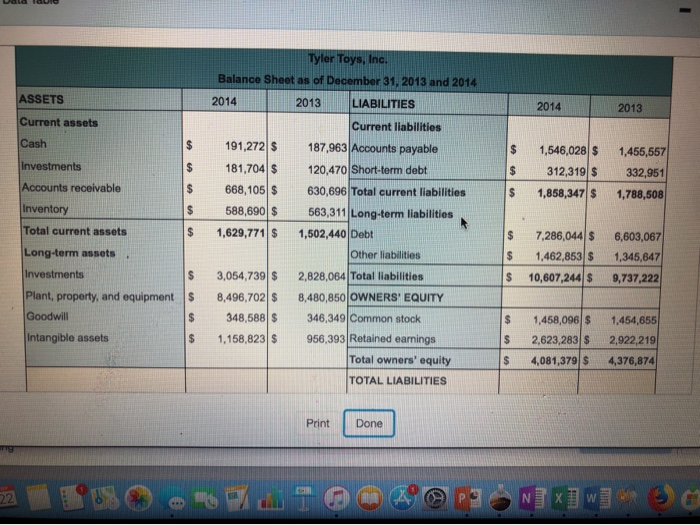
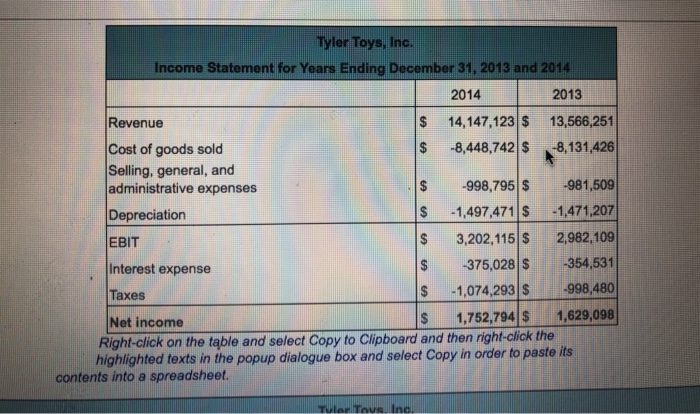
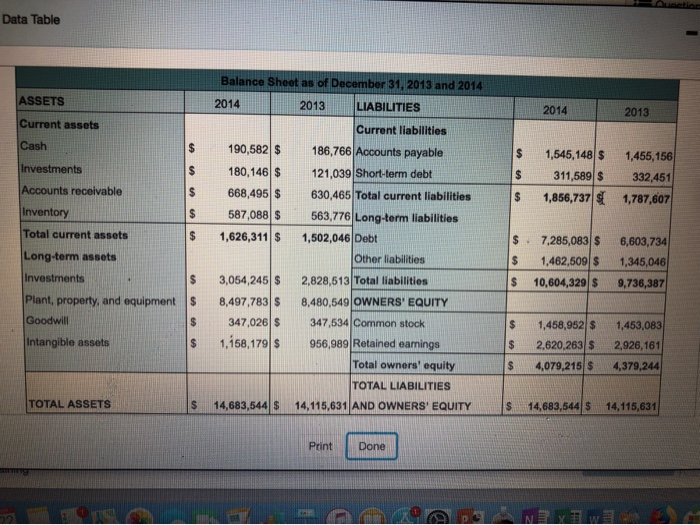
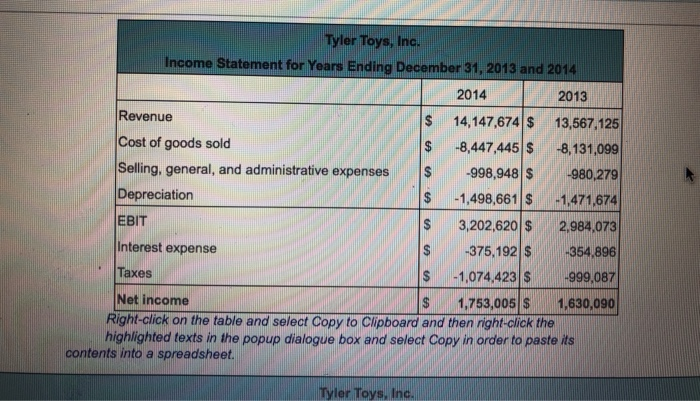
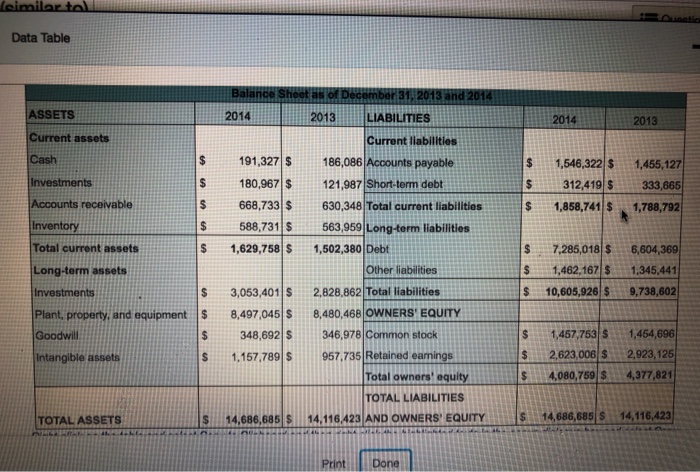
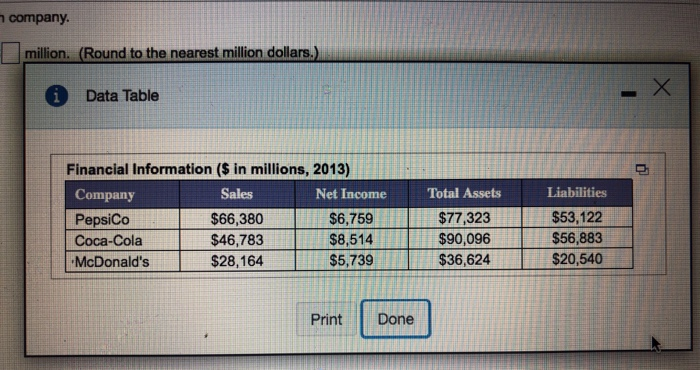
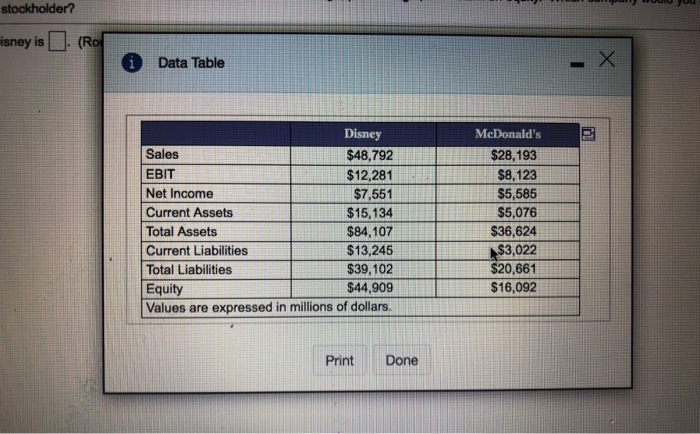
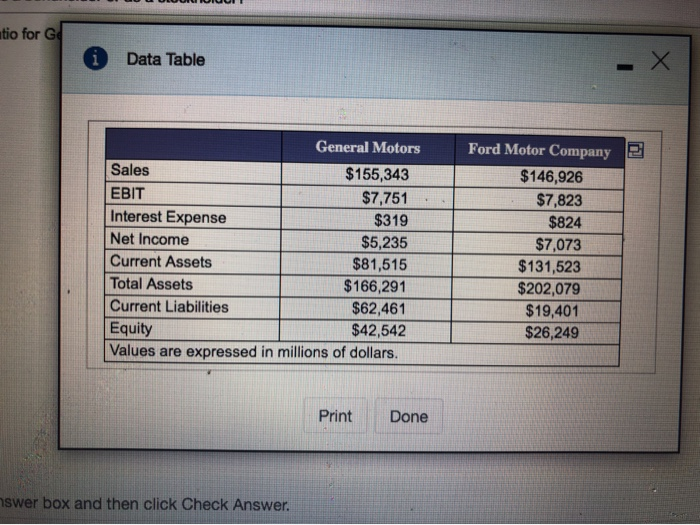
Save TIITICWIN. Ulapter 14 Homework Score: 0 of 1 pt 8 of 11 (0 complete) P14-12 (similar to) HW Score: 0%, 0 of 11 p Question Help Financial ratios: Profitability. The financial statements for Tyler Toys, Inc. are shown in the popup window Calculate the profit margin, return on assets, and return on equity for 2013 and 2014 for Tyler Toys. Should any of these ratios or the change in a ratio warrant concern for the managers of Tyler Toys or the shareholders? What is the profit margin for 2014? % (Round to two decimal places.) TIMEWUIK. Ullapler 14 Homework Save Score: 0 of 1 pt 9 of 11 (0 complete) HW Score: 0%, 0 of 11 pt P14-13 (similar to) Question Help DuPont identity. For the firms in the popup window, find the return on equity using the three components of the DuPont identity operating efficiency, as measured by the profit margin (net income/sales); asset management efficiency, as measured by asset turnover (sales/total assets); and financial leverage, as measured by the equity multiplier (total assets/total equity) First, find the equity of each company The equity for PepsiCo is 5 million (Round to the nearest million dollars.) P14-15 (similar to) Question Help Company analysis. Given the financial data in the popup window, m. for Disney (DIS) and McDonald's (MCO), compare these two companies using the following financial ratios: debt ratio, current ratio, total asset turnover, financial leverage, profit margin, and return on equity. Which company would you invest in either as bondholder or as a stockholder? The debt ratio for Disney is (Round to four decimal places.) P14-16 (similar to) Question Help Company analysis. Given the financial data in the popup window, for General Motors (GM) and Ford Motor Company (F). compare these two companies using the following financial ratios: times interest eamed ratio, current ratio, total asset turnover, financial leverage, profit margin, and return on equity. Which company would you invest in, either as a bondholder or as a stockholder? The times interest earned ratio for General Motors is (Round to four decimal places) (similar toll Data Table Tyler Toys, Inc. Income Statement for Years Ending December 31, 2013 and 2014 2014 2013 Revenue 14,146,598 $ 13,567,738 Cost of goods sold -8,447,465 $ -8,132,416 Selling, general, and administrative expenses -981,402 Depreciation -1,497,224 $ -1,472,584 EBIT 3,203,766 $ 2,981,336 Interest expense -375,518 $ -354,634 Taxes -1,074,734 $ -998,147 Net income 1,753,613 $ 1,628,555 Right click on the table and select Copy to Clipboard and then right-click the highlighted texts in the popup dialogue box and select Copy in order to paste its contents into a spreadsheet. Tyler Toys, Inc. Balance Sheet as of December 31, 2013 and 2014 Print Done 1 Data Table 2014 2013 LIABILITIES ASSETS Current assets 2014 2013 Cash 1,545,841 $ 311,203 S 1,857,044 S 1,455,839 332,698 1,788,537 Investments Accounts receivable Inventory Total current assets Long-term assets Investments Plant, property, and equipment Goodwill Intangible assets Balance Sheet as of December 31, 2013 and 2014 2013 LIABILITIES Current liabilities 191,528 $ 186,410 Accounts payable 181,300 $ 120,320 Short-term debt 667,458 $ 631,255 Total current liabilities 588,650 $ 563,126 Long-term liabilities 1,628,936 S 1,501,311 Debt Other liabilities 3,053,624 $ 2,828,744 Total liabilities 8,497,803 $ 8,480,155 OWNERS' EQUITY 348,443 $ 347.732 Common stock 1,157,282 $ 957,871 Retained earnings Total owners' equity TOTAL LIABILITIES 14,686,088 $ 14.115,813 AND OWNERS' EQUITY 7,286,547 $ 1,463,683 $ 10,607,274 $ 6,604,428 1,346,985 9,739,950 1,457,401 $ 2,621,413 S 4,078,814 5 1,454,899 2,920,964 4,375,863 TOTAL ASSETS S $ 14,686,088 $ 14.115,813 Print Done 22 5 m 2 PSONIX W 30 a Table Tyler Toys, Inc. Income Statement for Years Ending December 31, 2013 and 2014 2014 2013 Revenue 14,147,961 $ 13,587,575 Cost of goods sold -8,447,385 $ 8,131,352 Selling, general, and administrative expenses -997,467 $ -981,126 Depreciation -1,498,294 S -1,471,631 EBIT 3,204,815$ 2,983,466 Interest expense -376,113 $ -354,819 Taxes -1,074,907 $ -998,886 Net income 1,753,795 S 1,629,761 Right click on the table and select Copy to clipboard and then right-click the highlighted texts in the popup dialogue box and select Copy in order to paste its contents into a spreadsheet. A Tyler Toys, Inc. Balance Sheet as of December 31, 2013 and 2014 Point Done ASSETS Current assets 2014 2013 Cash 1,546,028 $ 312,319 $ 1,858,347$ 1,455,557 332,951 1,788,608 Investments Accounts receivable Inventory Total current assets Long-term assets. Investments Plant, property, and equipment Goodwill Intangible assets Tyler Toys, Inc. Balance Sheet as of December 31, 2013 and 2014 2014 2013 LIABILITIES Current liabilities 191,272 $ 187,963 Accounts payable 181,704 $ 120,470 Short-term debt 668,105 $ 630,696 Total current liabilities 588,690 $ 563,311 Long-term liabilities 1,629,771 S 1,502,440 Debt Other liabilities 3,054,739 $ 2,828,064 Total liabilities 8,496,702 $ 8,480,850 OWNERS' EQUITY 348,588 $ 346,349 Common stock 1,158,823 $ 956,393 Retained earnings Total owners' equity TOTAL LIABILITIES 7,286,044 $ 1,462,853 S 10,607,244 $ 6,603,067 1,346,647 9,737,222 $ 1,458,096 $ 2,623,283 $ 4,081,379$ 1,454,655 2,922,219 4,376,874 $ Print Done L om/ @ OPONIX] W Data Table 2014 2013 1,545,148 $ 311,589 $ 1,856,737s 1,455,156 332,451 1,787,607 s ASSETS Current assets Cash Investments Accounts receivable Inventory Total current assets Long-term assets Investments Plant, property, and equipment Goodwill Intangible assets $ Balance Sheet as of December 31, 2013 and 2014 2014 LIABILITIES Current liabilities 190,582 $ 186,766 Accounts payable 180,146 $ 121,039 Short-term debt 668,495 $ 630,465 Total current liabilities 587,088 S 563,776 Long-term liabilities 1,626,311 $ 1,502,046 Debt Other liabilities 3,054,245 $ 2,828,513 Total liabilities 8,497,783 $ 8,480,549 OWNERS' EQUITY 347,026 $ 347,534 Common stock 1,158,179$ 956,989 Retained earnings Total owners' equity TOTAL LIABILITIES 14,683,544 S 14,115,631 AND OWNERS' EQUITY $. 7,285,083 S 1,462,509 $ 10,604,329 $ 6,603,734 1,345,046 9,736,387 1,458,952 $ 2,620,263 $ 4,079,215 $ 1,453,083 2,926,161 4,379,244 TOTAL ASSETS $ 14,683,544 S 14,115,631 Punt Done LOGO AMEM Tyler Toys, Inc. Income Statement for Years Ending December 31, 2013 and 2014 2014 2013 Revenue 14,147,674 $ 13,567,125 Cost of goods sold -8,447,445 $ -8,131,099 Selling, general, and administrative expenses -998,948 $ -980,279 Depreciation -1,498,661 $ 1,471,674 EBIT 3,202,620 $ 2,984,073 Interest expense -375,192 S -354,896 Taxes -1,074,423 S -999,087 Net income 1,753,005 S 1,630,090 Right click on the table and select Copy to Clipboard and then right-click the highlighted texts in the popup dialogue box and select Copy in order to paste is contents into a spreadsheet. Tyler Toys, Inc. (similar toll Data Table ASSETS 2014 2013 Current assets Cash Investments 1,546,322 $ 312,419 $ 1,858,741 $ 1,455,127 333,665 1,788,792 Accounts receivable Inventory Total current assets $ Long-term assets Investments $ Plant, property, and equipment $ Goodwill Intangible assets $ Balance Sheet as of December 31, 2013 and 201 2014 LIABILITIES Current liabilities 191,327 $ 186,086 Accounts payable 180,967 $ 121,987 Short-term debt 668,733 $ 630,348 Total current liabilities 588,731 $ 563,959 Long-term liabilities 1,629,758 S 1,502,380 Debt Other liabilities 3,053,401 $ 2,828,862 Total liabilities 8,497,045 S 8,480,468 OWNERS' EQUITY 348,692 $ 346,978 Common stock 1,157,789 $ 957,735 Retained earnings Total owners' equity TOTAL LIABILITIES 14,686,685 $ 14.116.423 AND OWNERS' EQUITY 7,285,018 $ 1,462,167 $ 10,605,926 S 6,604,369 1,345,441 9,738,602 1,457,753 $ 2,623,006 S 4,080,769 S. 1,454,696 2,923, 125 4,377,821 TOTAL ASSETS $ $ 14,686,685 S 14,116,423 Print Done company. million. (Round to the nearest million dollars. Data Table Financial Information ($ in millions, 2013) Company Sales Net Income PepsiCo $66,380 $6,759 Coca-Cola $46,783 $8,514 McDonald's $28,164 $5,739 Total Assets $77,323 $90,096 $36,624 Liabilities $53,122 $56,883 $20,540 Print Done Topul oid u stockholder? isney is . (Ro Data Table Disney Sales $48,792 EBIT $12,281 Net Income $7,551 Current Assets $15,134 Total Assets $84,107 Current Liabilities $13,245 Total Liabilities $39,102 Equity $44,909 Values are expressed in millions of dollars. McDonald's $28,193 $8,123 $5,585 $5,076 $36,624 $3,022 $20,661 $16,092 Print Done tio for G Data Table General Motors Sales $155,343 EBIT $7,751 Interest Expense $319 Net Income $5,235 Current Assets $81,515 Total Assets $166,291 Current Liabilities $62,461 Equity $42,542 Values are expressed in millions of dollars. Ford Motor Company $146,926 $7,823 $824 $7,073 $131,523 $202,079 $19,401 $26,249 Print Done nswer box and then click Check
Step by Step Solution
There are 3 Steps involved in it

Get step-by-step solutions from verified subject matter experts