

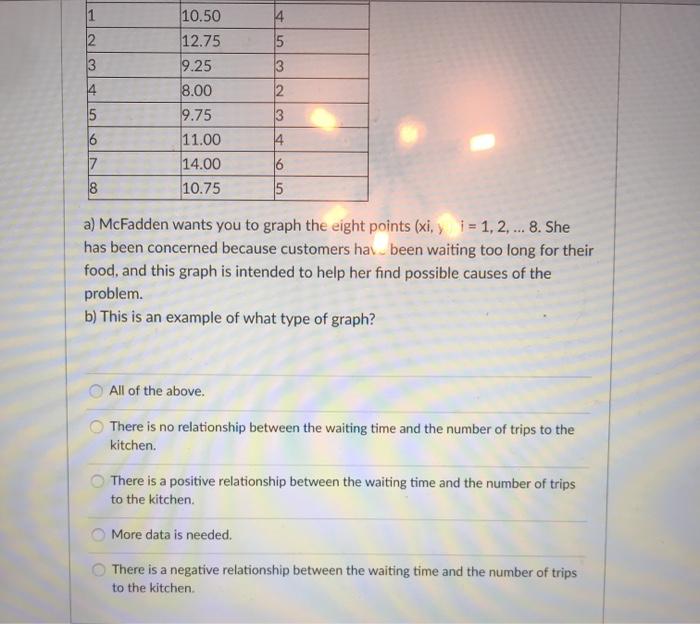
Question: question part 1 question part 2 Chapter 6. Question 5. part a: Kathleen McFadden's restaurant in Boston has recorded the following data for eight recent
question part 1 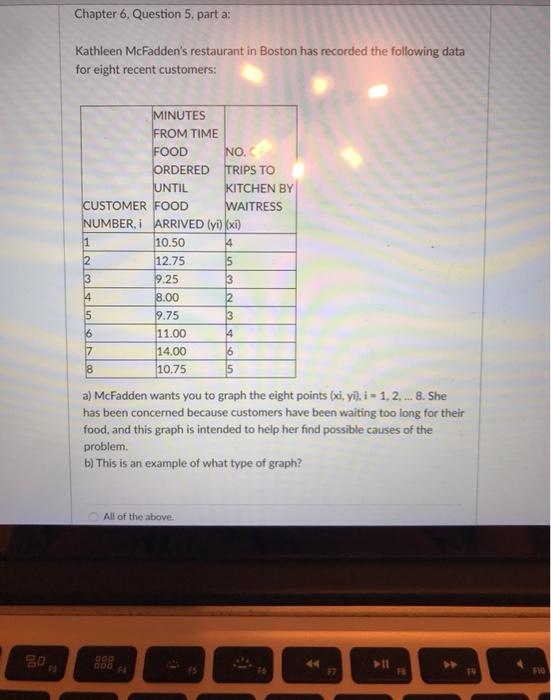
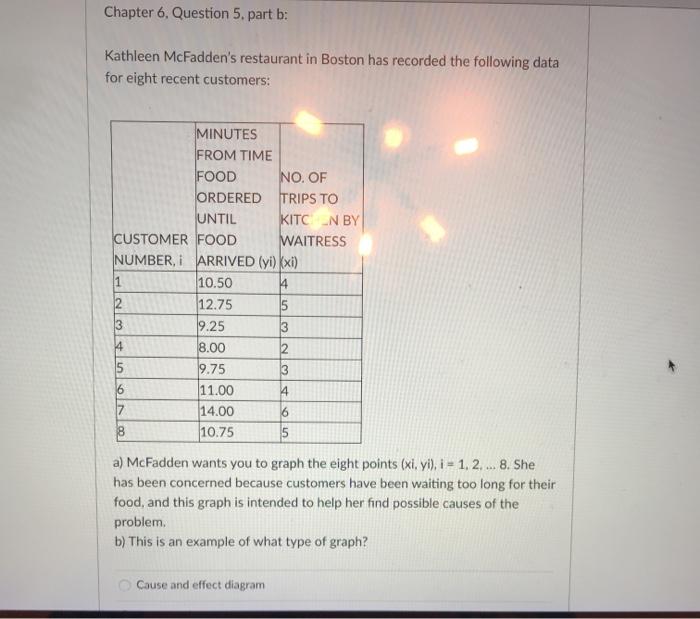
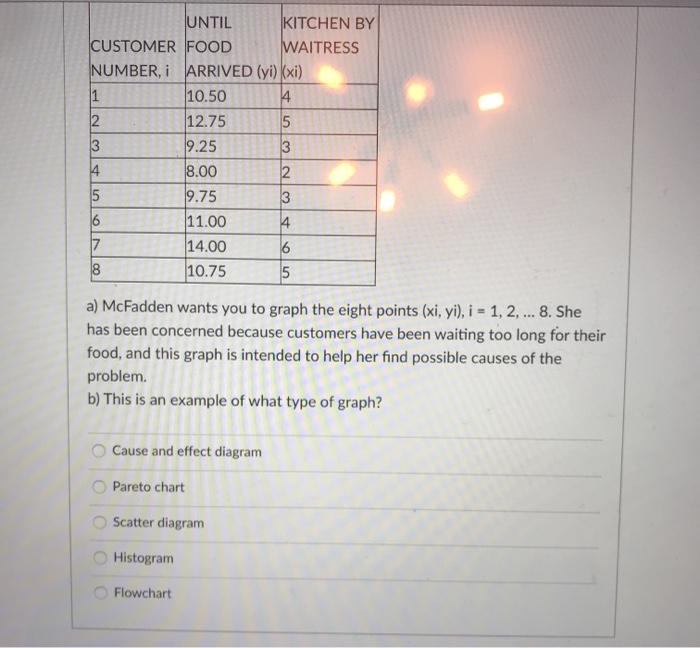
question part 2
Step by Step Solution
There are 3 Steps involved in it
1 Expert Approved Answer
Step: 1 Unlock

Question Has Been Solved by an Expert!
Get step-by-step solutions from verified subject matter experts
Step: 2 Unlock
Step: 3 Unlock