

Question: Question: PART 1: Write the appropriate functions in B3 and C3 which will bring the sales and brand information from Table 2 for the corresponding
Question:
PART 1:
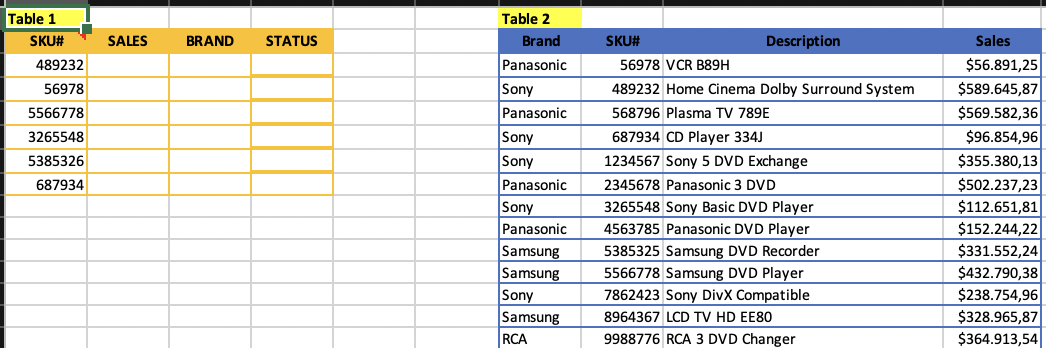
Write the appropriate functions in B3 and C3 which will bring the sales and brand information from Table 2 for the corresponding SKU#. Do not make any changes on the existing Table 2, make a copy of it elsewhere if you need to make changes, but do not delete any data. (When copied to the other cells, the functions in B3 and C3 should work without a need to make any changes on it. Only the functions in B3 and C3 will be graded.)
PART 2:
*Create another table which will help us identify the sales status ('STATUS') of each SKU in Table 1 as described below:
If 0
If 100,001
If 250,001
If Sales amount >= 500,001 then STATUS is EXTRAORDINARY
*Write a VLOOKUP function in D3 which will bring the status of the corresponding SKU# from the table you created in the previous step. (When copied to the other cells, the function in D3 should work without a need to make any changes on it. Only the functions in D3 will be graded.)
QUESTION:
PART I:
Write an IF function in B3 as explained below to calculate the value of f(x) for a given x:
If x is less than 3 then f(x) is equal to 4.5
Else if x is greater than or equal to 3 and less than 5 then f(x) is equal to 7.5
Else if x is greater than or equal to 5 and less than 8 then f(x) is equal to 0.5
Else f(x) is equal to 2.5.
(When copied to the other cells, the function in B3 should work without a need to make any changes on it. Only the function in B3 will be graded.)
PART II:
Write a VLOOKUP function in C3 which will bring the f(x) for a given x from the table (table_array) you created using the criteria given in the previous part. (When copied to the other cells, the function in C3 should work without a need to make any changes on it. Only the function in C3 will be graded.)
PART III:
Draw an appropriate chart of f(x) vs.x, where the x-axis will increase in increments of 1 from 0 to 10. Join the markers, if any, with a solid line. (Notice that x and f(x) are both numbers.) Add a title to your chart and label the axes. (For f(x), you can use either the ones you calculated in Part I or the ones in Part II; they should be the same anyway.)
Table 1 SKU# SALES BRAND STATUS 489232 56978 5566778 3265548 5385326 687934 Table 2 Brand Panasonic Sony Panasonic Sony Sony Panasonic Sony Panasonic Samsung Samsung SKU# Description 56978 VCR 889H 489232 Home Cinema Dolby Surround System 568796 Plasma TV 789E 687934 CD Player 334) 1234567 Sony 5 DVD Exchange 2345678 Panasonic 3 DVD 3265548 Sony Basic DVD Player 4563785 Panasonic DVD Player 5385325 Samsung DVD Recorder 5566778 Samsung DVD Player 7862423 Sony DivX Compatible 8964367 LCD TV HD EE80 9988776 RCA 3 DVD Changer Sales $56.891,25 $589.645,87 $569.582,36 $96.854,96 $355.380,13 $502.237,23 $112.651,81 $152.244,22 $331.552,241 $432.790,38 $238.754,96 $328.965,87 $364.913,54 Sony Samsung RCA Table 1 SKU# SALES BRAND STATUS 489232 56978 5566778 3265548 5385326 687934 Table 2 Brand Panasonic Sony Panasonic Sony Sony Panasonic Sony Panasonic Samsung Samsung SKU# Description 56978 VCR 889H 489232 Home Cinema Dolby Surround System 568796 Plasma TV 789E 687934 CD Player 334) 1234567 Sony 5 DVD Exchange 2345678 Panasonic 3 DVD 3265548 Sony Basic DVD Player 4563785 Panasonic DVD Player 5385325 Samsung DVD Recorder 5566778 Samsung DVD Player 7862423 Sony DivX Compatible 8964367 LCD TV HD EE80 9988776 RCA 3 DVD Changer Sales $56.891,25 $589.645,87 $569.582,36 $96.854,96 $355.380,13 $502.237,23 $112.651,81 $152.244,22 $331.552,241 $432.790,38 $238.754,96 $328.965,87 $364.913,54 Sony Samsung RCA
Step by Step Solution
There are 3 Steps involved in it

Get step-by-step solutions from verified subject matter experts