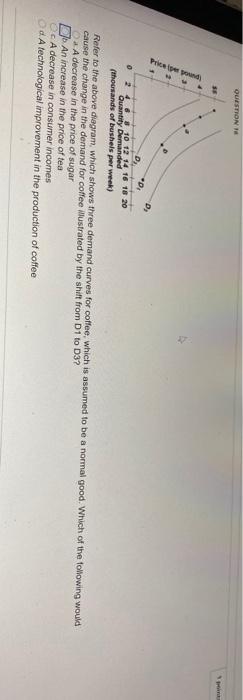
Question: QUESTION Pero 0 2 4 6 8 10 12 14 16 18 20 Quantity Demanded (thousands of bushels per week) Refer to the above diagram,

QUESTION Pero 0 2 4 6 8 10 12 14 16 18 20
QUESTION Pero 0 2 4 6 8 10 12 14 16 18 20 Quantity Demanded (thousands of bushels per week) Refer to the above diagram, which shows three demand curves for coffee, which is assumed to be a normal good. Which of the following would cause the change in the demand for coffee ilustrated by the shift from D1 to 03? A decrease in the price of sugar 7. An increase in the price of tea O c A decrease in consumer incomes Od A technological improvement in the production of coffee

Step by Step Solution

There are 3 Steps involved in it

1 Expert Approved Answer
Step: 1 Unlock blur-text-image
Question Has Been Solved by an Expert!

Get step-by-step solutions from verified subject matter experts

Step: 2 Unlock
Step: 3 Unlock

Students Have Also Explored These Related General Management Questions!