

Question: Question: please give a brief analysis for the vertical analysis income statement for company xyz Income Statement-USD Millions Mereme Cost of Goods Sold Gross Profit
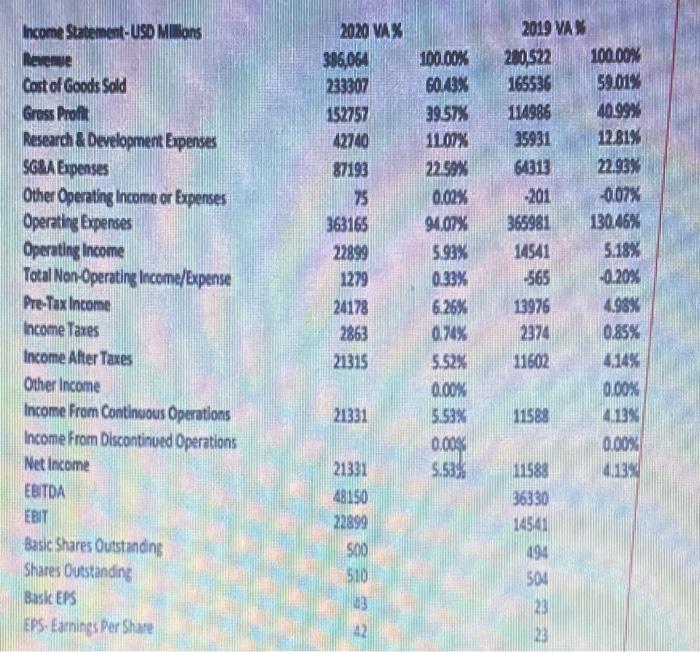
Income Statement-USD Millions Mereme Cost of Goods Sold Gross Profit Research & Development Expenses SGBA Expenses Other Operating Income or Expenses Operating Expenses Operating Income Total Non-Operating Income/Expense Pre-Tax Income Income Taxes Income Alter Taxes Other Income Income From Continuous Operations Income From Discontinued Operations Net Income EBITDA EBIT Basic Shares Outstanding Shares Outstanding Basic EPS EPS. Earnings Per Share 2020 VAX 386,064 233307 152757 42740 87193 75 363165 22899 1279 24178 2863 21315 100.00% 60.23% 39.57% 11.07% 22.59% 0.02% 91.07% 5.93% 0.33% 6.26% 0.74% 5.52% 0.00% 5.53% 0.008 5.53% 2019 VAS 200522 100.00% 165536 59.01% 114986 40.99% 35931 12.81% 61013 22.93% 201 -0.07% 365981 130.46% 14541 5.18% -565 -0.20% 13976 4.98% 237 0.85% 11602 4.14% 0.00% 11588 13% 0.00% 11588 4,13% 136330 14541 094 504 23 20 21331 21331 48150 22899 500 510 13 42
Step by Step Solution
There are 3 Steps involved in it

Get step-by-step solutions from verified subject matter experts