

Question: Question: Please provide an answer along with EXCEL formulas to this scenario.... Same scenario with additional questions, please include steps with EXCEL formulas.... New follow
Question: Please provide an answer along with EXCEL formulas to this scenario....
Same scenario with additional questions, please include steps with EXCEL formulas....
New follow up scenario with additional questions, please include steps with EXCEL formulas....
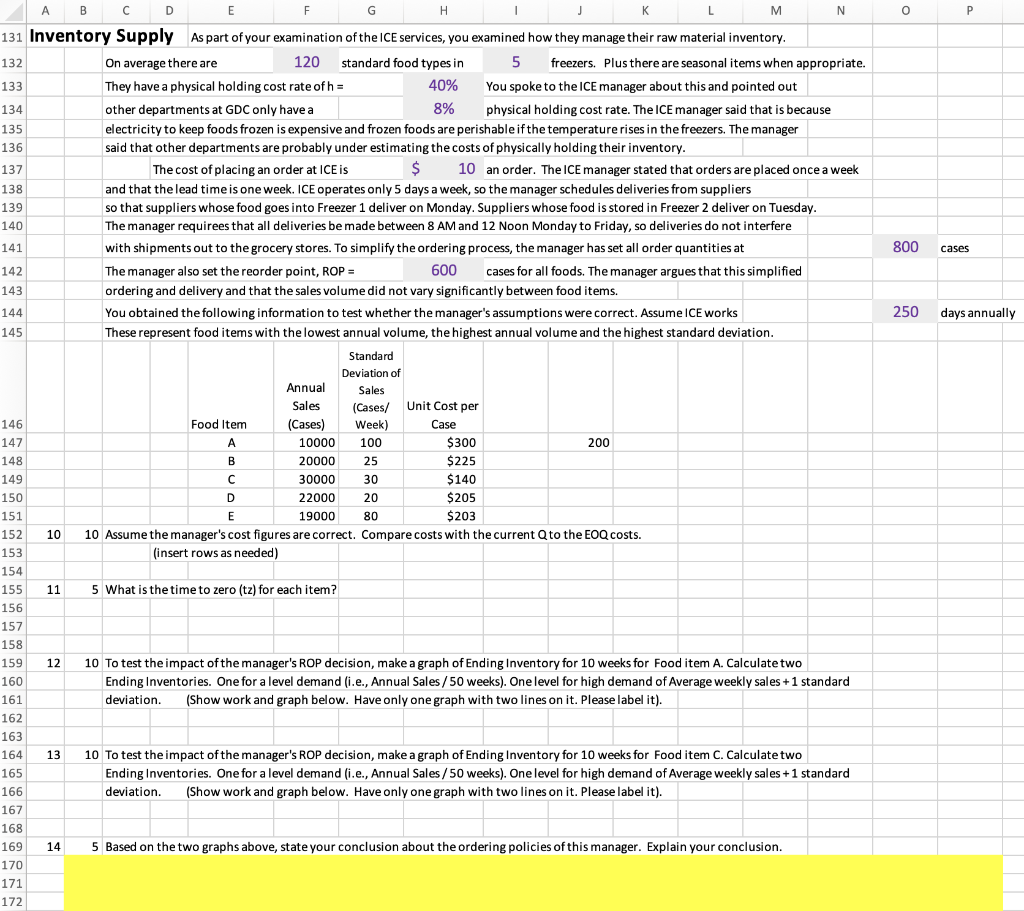
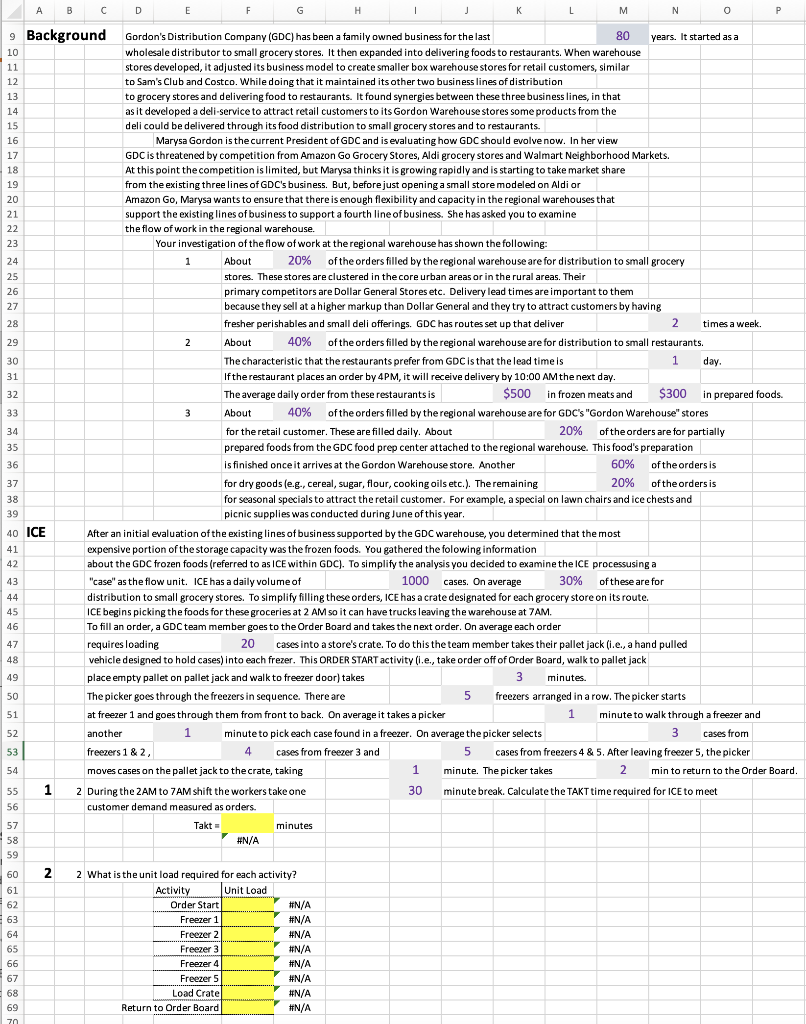
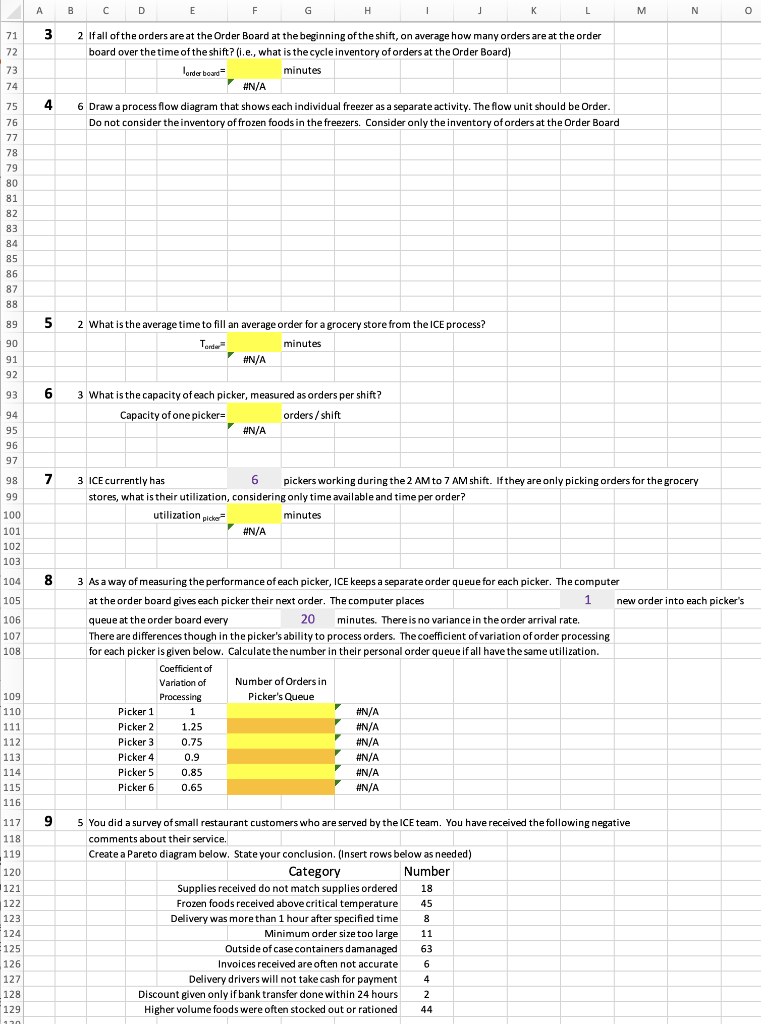
0 3 A B C D E F G H J L M N 9 Background Gordon's Distribution Company (GDC) has been a family owned business for the last 80 years. It started as a 10 wholesale distributor to small grocery stores. It then expanded into delivering foods to restaurants. When warehouse 11 stores developed, it adjusted its business model to create smaller box warehouse stores for retail customers, similar 12 to Sam's Club and Costco. While doing that it maintained its other two business lines of distribution 13 to grocery stores and delivering food to restaurants. It found synergies between these three business lines, in that 14 as it developed a deli-service to attract retail customers to its Gordon Warehouse stores some products from the 15 deli could be delivered through its food distribution to small grocery stores and to restaurants. 16 Marysa Gordon is the current President of GDC and is evaluating how GDC should evolve now. In her view 17 GDC is threatened by competition from Amazon Go Grocery Stores, Aldi grocery stores and Walmart Neighborhood Markets. 18 At this point the competition is limited, but Marysa thinks it is growing rapidly and is starting to take market share 19 from the existing three lines of GDC's business. But, before just opening a small store modeled on Aldi or 20 Amazon Go, Marysa wants to ensure that there is enough flexibility and capacity in the regional warehouses that 21 support the existing lines of business to support a fourth line of business. She has asked you to examine 22 the flow of work in the regional warehouse. 23 Your investigation of the flow of work at the regional warehouse has shown the following: 24 1 About 20% of the orders filled by the regional warehouse are for distribution to small grocery 25 stores. These stores are clustered in the core urban areas or in the rural areas. Their 26 primary competitors are Dollar General Stores etc. Delivery lead times are important to them 27 because they sell at a higher markup than Dollar General and they try to attract customers by having 28 fresher perishables and small deli offerings. GDC has routes set up that deliver 2 times a week. 29 2 About 40% of the orders filled by the regional warehouse are for distribution to small restaurants. 30 The characteristic that the restaurants prefer from GDC is that the lead time is 1 day. 31 If the restaurant places an order by 4PM, it will receive delivery by 10:00 AM the next day. 32 The average daily order from these restaurants is $500 in frozen meats and $300 in prepared foods. 33 About 40% of the orders filled by the regional warehouse are for GDC's "Gordon Warehouse" stores 34 for the retail customer. These are filled daily. About 20% of the orders are for partially 35 prepared foods from the GDC food prep center attached to the regional warehouse. This food's preparation 36 is finished once it arrives at the Gordon Warehouse store. Another . 60% of the orders is 37 for dry goods (e.g., cereal, sugar, flour, cooking oils etc.). The remaining 20% of the orders is 38 for seasonal specials to attract the retail customer. For example, a special on lawn chairs and ice chests and 39 picnic supplies was conducted during June of this year. After an initial evaluation of the existing lines of business supported by the GDC warehouse, you determined that the most 41 expensive portion of the storage capacity was the frozen foods. You gathered the folowing information 44 42 about the GDC frozen foods (referred to as ICE within GDC). To simplify the analysis you decided to examine the ICE processusing a 43 "case" as the flow unit. ICE has a daily volume of 1000 cases. On average 30% of these are for 44 distribution to small grocery stores. To simplify filling these orders, ICE has a crate designated for each grocery store on its route. 45 ins picking the foods for these groceries at 2 AM so it can have trucks leaving the warehouse at 7AM. 46 To fill an order, a GDC team member goes to the Order Board and takes the next order. On average each order 47 requires loading 20 cases into a store's crate. To do this the team member takes their pallet jack (.e., a hand pulled 48 vehicle designed to hold cases) into each frezer. This ORDER START activity (i.e., take order off of Order Board, walk to pallet jack 49 place empty pallet on pallet jack and walk to freezer door) takes 3 minutes. 50 The picker goes through the freezers in sequence. There are 5 freezers arranged in a row. The picker starts 51 at freezer 1 and goes through them from front to back. On average it takes a picker 1 minute to walk through a freezer and 52 another 1 minute to pick each case found in a freezer. On average the picker selects 3 cases from 53 freezers 1&2, 4 cases from freezer 3 and 5 cases from freezers 4 & 5. After leaving freezer 5, the picker 54 moves cases on the pallet jack to the crate, taking , 1 minute. The picker takes 2 min to return to the Order Board. . 55 1 2 During the 2AM to 7AM shift the workers take one 30 minute break. Calculate the TAKT time required for ICE to meet 56 customer demand measured as orders. 57 Takt minutes 58 #N/A 59 60 2 2 What is the unit load required for each activity? 61 Activity Unit Load 62 Order Start #N/A 63 Freezer 1 #N/A 64 Freezer 2 #N/A 65 Freezer 3 #N/A 66 Freezer 4 #N/A 67 Freezer 5 #N/A 68 Load Crate #N/A 69 Return to Order Board #N/A 40 ICE ICE begins A H M N o 3 71 72 73 B C D E F G J L 2 Ifall of the orders are at the Order Board at the beginning of the shift, on average how many orders are at the order board over the time of the shift? (i.e., what is the cycle inventory of orders at the Order Board) lender board minutes #N/A 6 Draw a process flow diagram that shows each individual freezer as a separate activity. The flow unit should be Order. Do not consider the inventory of frozen foods in the freezers. Consider only the inventory of orders at the Order Board 74 4 75 76 77 78 79 80 81 82 83 84 85 86 87 88 89 5 90 91 92 2 What is the average time to fill an average order for a grocery store from the ICE process? Torder minutes #N/A 93 6 3 What is the capacity of each picker, measured as orders per shift? Capacity of one picker= orders / shift #N/A 94 95 96 97 7 98 99 3 ICE currently has 6 pickers working during the 2 AM to 7 AM shift. If they are only picking orders for the grocery stores, what is their utilization, considering only time available and time per order? utilization picker minutes #N/A 100 101 102 103 104 8 105 106 107 108 3 As a way of measuring the performance of each picker, ICE keeps a separate order queue for each picker. The computer at the order board gives each picker their next order. The computer places 1 new order into each picker's queue at the order board every 20 minutes. There is no variance in the order arrival rate. There are differences though in the picker's ability to process orders. The coefficient of variation of order processing for each picker is given below. Calculate the number in their personal order queue if all have the same utilization. Coefficient of Number of Orders in Processing Picker's Queue Picker 1 1 #N/A # Picker 2 1.25 #N/A Picker 3 0.75 #N/A Picker 4 0.9 #N/A Picker 5 5 0.85 #N/A Picker 6 0.65 #N/A Variation of 109 110 111 112 113 114 115 116 9 117 118 119 120 121 122 123 124 125 126 127 128 129 1201 5 You did a survey of small restaurant customers who are served by the ICE team. You have received the following negative comments about their service. Create a Pareto diagram below. State your conclusion. (Insert rows below as needed) Category Number Supplies received do not match supplies ordered 18 Frozen foods received above critical temperature 45 Delivery was more than 1 hour after specified time 8 Minimum order size too large 11 Outside of case containers damanaged 63 Invoices received are often not accurate 6 Delivery drivers will not take cash for payment 4 Discount given only if bank transfer done within 24 hours 2 Higher volume foods were often stocked out or rationed 44 N O P 800 cases 250 days annually A B C D E F G . K L M 131 Inventory Supply As part of your examination of the ICE services, you examined how they manage their raw material inventory. 132 On average there are 120 standard food types in 5 freezers. Plus there are seasonal items when appropriate. 133 They have a physical holding cost rate of h = 40% You spoke to the ICE manager about this and pointed out 134 other departments at GDC only have a 8% physical holding cost rate. The ICE manager said that is because 135 electricity to keep foods frozen is expensive and frozen foods are perishable if the temperature rises in the freezers. The manager 136 said that other departments are probably under estimating the costs of physically holding their inventory. 137 The cost of placing an order at ICE is $ 10 an order. The ICE manager stated that orders are placed once a week 138 and that the lead time is one week. ICE operates only 5 days a week, so the manager schedules deliveries from suppliers 139 so that suppliers whose food goes into Freezer 1 deliver on Monday. Suppliers whose food is stored in Freezer 2 deliver on Tuesday. 140 The manager requirees that all deliveries be made between 8 AM and 12 Noon Monday to Friday, so deliveries do not interfere 141 with shipments out to the grocery stores. To simplify the ordering process, the manager has set all order quantities at 142 The manager also set the reorder point, ROP = 600 cases for all foods. The manager argues that this simplified 143 ordering and delivery and that the sales volume did not vary significantly between food items. 144 You obtained the following information to test whether the manager's assumptions were correct. Assume ICE works 145 These represent food items with the lowest annual volume, the highest annual volume and the highest standard deviation. Standard Deviation of Annual Sales Sales (Cases/ Unit Cost per 146 Food Item (Cases) Week) Case 147 10000 100 $300 200 148 20000 $225 149 30000 30 $140 150 D 22000 20 $205 151 E 19000 80 152 10 10 Assume the manager's cost figures are correct. Compare costs with the current Q to the EOQ costs. 153 (insert rows as needed) 154 155 11 5 What is the time to zero (tz) for each item? 156 157 158 159 10 To test the impact of the manager's ROP decision, make a graph of Ending Inventory for 10 weeks for Food item A. Calculate two 160 Ending Inventories. One for a level demand (i.e., Annual Sales / 50 weeks). One level for high demand of Average weekly sales +1 standard 161 deviation. (Show work and graph below. Have only one graph with two lines on it. Please label it). 162 163 164 13 10 To test the impact of the manager's ROP decision, make a graph of Ending Inventory for 10 weeks for Food item C. Calculate two 165 Ending Inventories. One for a level demand (i.e., Annual Sales / 50 weeks). One level for high demand of Average weekly sales +1 standard 166 deviation. (Show work and graph below. Have only one graph with two lines on it. Please label it). 167 168 169 14 5 Based on the two graphs above, state your conclusion about the ordering policies of this manager. Explain your conclusion. 170 B 25 $203 12 171 172 0 3 A B C D E F G H J L M N 9 Background Gordon's Distribution Company (GDC) has been a family owned business for the last 80 years. It started as a 10 wholesale distributor to small grocery stores. It then expanded into delivering foods to restaurants. When warehouse 11 stores developed, it adjusted its business model to create smaller box warehouse stores for retail customers, similar 12 to Sam's Club and Costco. While doing that it maintained its other two business lines of distribution 13 to grocery stores and delivering food to restaurants. It found synergies between these three business lines, in that 14 as it developed a deli-service to attract retail customers to its Gordon Warehouse stores some products from the 15 deli could be delivered through its food distribution to small grocery stores and to restaurants. 16 Marysa Gordon is the current President of GDC and is evaluating how GDC should evolve now. In her view 17 GDC is threatened by competition from Amazon Go Grocery Stores, Aldi grocery stores and Walmart Neighborhood Markets. 18 At this point the competition is limited, but Marysa thinks it is growing rapidly and is starting to take market share 19 from the existing three lines of GDC's business. But, before just opening a small store modeled on Aldi or 20 Amazon Go, Marysa wants to ensure that there is enough flexibility and capacity in the regional warehouses that 21 support the existing lines of business to support a fourth line of business. She has asked you to examine 22 the flow of work in the regional warehouse. 23 Your investigation of the flow of work at the regional warehouse has shown the following: 24 1 About 20% of the orders filled by the regional warehouse are for distribution to small grocery 25 stores. These stores are clustered in the core urban areas or in the rural areas. Their 26 primary competitors are Dollar General Stores etc. Delivery lead times are important to them 27 because they sell at a higher markup than Dollar General and they try to attract customers by having 28 fresher perishables and small deli offerings. GDC has routes set up that deliver 2 times a week. 29 2 About 40% of the orders filled by the regional warehouse are for distribution to small restaurants. 30 The characteristic that the restaurants prefer from GDC is that the lead time is 1 day. 31 If the restaurant places an order by 4PM, it will receive delivery by 10:00 AM the next day. 32 The average daily order from these restaurants is $500 in frozen meats and $300 in prepared foods. 33 About 40% of the orders filled by the regional warehouse are for GDC's "Gordon Warehouse" stores 34 for the retail customer. These are filled daily. About 20% of the orders are for partially 35 prepared foods from the GDC food prep center attached to the regional warehouse. This food's preparation 36 is finished once it arrives at the Gordon Warehouse store. Another . 60% of the orders is 37 for dry goods (e.g., cereal, sugar, flour, cooking oils etc.). The remaining 20% of the orders is 38 for seasonal specials to attract the retail customer. For example, a special on lawn chairs and ice chests and 39 picnic supplies was conducted during June of this year. After an initial evaluation of the existing lines of business supported by the GDC warehouse, you determined that the most 41 expensive portion of the storage capacity was the frozen foods. You gathered the folowing information 44 42 about the GDC frozen foods (referred to as ICE within GDC). To simplify the analysis you decided to examine the ICE processusing a 43 "case" as the flow unit. ICE has a daily volume of 1000 cases. On average 30% of these are for 44 distribution to small grocery stores. To simplify filling these orders, ICE has a crate designated for each grocery store on its route. 45 ins picking the foods for these groceries at 2 AM so it can have trucks leaving the warehouse at 7AM. 46 To fill an order, a GDC team member goes to the Order Board and takes the next order. On average each order 47 requires loading 20 cases into a store's crate. To do this the team member takes their pallet jack (.e., a hand pulled 48 vehicle designed to hold cases) into each frezer. This ORDER START activity (i.e., take order off of Order Board, walk to pallet jack 49 place empty pallet on pallet jack and walk to freezer door) takes 3 minutes. 50 The picker goes through the freezers in sequence. There are 5 freezers arranged in a row. The picker starts 51 at freezer 1 and goes through them from front to back. On average it takes a picker 1 minute to walk through a freezer and 52 another 1 minute to pick each case found in a freezer. On average the picker selects 3 cases from 53 freezers 1&2, 4 cases from freezer 3 and 5 cases from freezers 4 & 5. After leaving freezer 5, the picker 54 moves cases on the pallet jack to the crate, taking , 1 minute. The picker takes 2 min to return to the Order Board. . 55 1 2 During the 2AM to 7AM shift the workers take one 30 minute break. Calculate the TAKT time required for ICE to meet 56 customer demand measured as orders. 57 Takt minutes 58 #N/A 59 60 2 2 What is the unit load required for each activity? 61 Activity Unit Load 62 Order Start #N/A 63 Freezer 1 #N/A 64 Freezer 2 #N/A 65 Freezer 3 #N/A 66 Freezer 4 #N/A 67 Freezer 5 #N/A 68 Load Crate #N/A 69 Return to Order Board #N/A 40 ICE ICE begins A H M N o 3 71 72 73 B C D E F G J L 2 Ifall of the orders are at the Order Board at the beginning of the shift, on average how many orders are at the order board over the time of the shift? (i.e., what is the cycle inventory of orders at the Order Board) lender board minutes #N/A 6 Draw a process flow diagram that shows each individual freezer as a separate activity. The flow unit should be Order. Do not consider the inventory of frozen foods in the freezers. Consider only the inventory of orders at the Order Board 74 4 75 76 77 78 79 80 81 82 83 84 85 86 87 88 89 5 90 91 92 2 What is the average time to fill an average order for a grocery store from the ICE process? Torder minutes #N/A 93 6 3 What is the capacity of each picker, measured as orders per shift? Capacity of one picker= orders / shift #N/A 94 95 96 97 7 98 99 3 ICE currently has 6 pickers working during the 2 AM to 7 AM shift. If they are only picking orders for the grocery stores, what is their utilization, considering only time available and time per order? utilization picker minutes #N/A 100 101 102 103 104 8 105 106 107 108 3 As a way of measuring the performance of each picker, ICE keeps a separate order queue for each picker. The computer at the order board gives each picker their next order. The computer places 1 new order into each picker's queue at the order board every 20 minutes. There is no variance in the order arrival rate. There are differences though in the picker's ability to process orders. The coefficient of variation of order processing for each picker is given below. Calculate the number in their personal order queue if all have the same utilization. Coefficient of Number of Orders in Processing Picker's Queue Picker 1 1 #N/A # Picker 2 1.25 #N/A Picker 3 0.75 #N/A Picker 4 0.9 #N/A Picker 5 5 0.85 #N/A Picker 6 0.65 #N/A Variation of 109 110 111 112 113 114 115 116 9 117 118 119 120 121 122 123 124 125 126 127 128 129 1201 5 You did a survey of small restaurant customers who are served by the ICE team. You have received the following negative comments about their service. Create a Pareto diagram below. State your conclusion. (Insert rows below as needed) Category Number Supplies received do not match supplies ordered 18 Frozen foods received above critical temperature 45 Delivery was more than 1 hour after specified time 8 Minimum order size too large 11 Outside of case containers damanaged 63 Invoices received are often not accurate 6 Delivery drivers will not take cash for payment 4 Discount given only if bank transfer done within 24 hours 2 Higher volume foods were often stocked out or rationed 44 N O P 800 cases 250 days annually A B C D E F G . K L M 131 Inventory Supply As part of your examination of the ICE services, you examined how they manage their raw material inventory. 132 On average there are 120 standard food types in 5 freezers. Plus there are seasonal items when appropriate. 133 They have a physical holding cost rate of h = 40% You spoke to the ICE manager about this and pointed out 134 other departments at GDC only have a 8% physical holding cost rate. The ICE manager said that is because 135 electricity to keep foods frozen is expensive and frozen foods are perishable if the temperature rises in the freezers. The manager 136 said that other departments are probably under estimating the costs of physically holding their inventory. 137 The cost of placing an order at ICE is $ 10 an order. The ICE manager stated that orders are placed once a week 138 and that the lead time is one week. ICE operates only 5 days a week, so the manager schedules deliveries from suppliers 139 so that suppliers whose food goes into Freezer 1 deliver on Monday. Suppliers whose food is stored in Freezer 2 deliver on Tuesday. 140 The manager requirees that all deliveries be made between 8 AM and 12 Noon Monday to Friday, so deliveries do not interfere 141 with shipments out to the grocery stores. To simplify the ordering process, the manager has set all order quantities at 142 The manager also set the reorder point, ROP = 600 cases for all foods. The manager argues that this simplified 143 ordering and delivery and that the sales volume did not vary significantly between food items. 144 You obtained the following information to test whether the manager's assumptions were correct. Assume ICE works 145 These represent food items with the lowest annual volume, the highest annual volume and the highest standard deviation. Standard Deviation of Annual Sales Sales (Cases/ Unit Cost per 146 Food Item (Cases) Week) Case 147 10000 100 $300 200 148 20000 $225 149 30000 30 $140 150 D 22000 20 $205 151 E 19000 80 152 10 10 Assume the manager's cost figures are correct. Compare costs with the current Q to the EOQ costs. 153 (insert rows as needed) 154 155 11 5 What is the time to zero (tz) for each item? 156 157 158 159 10 To test the impact of the manager's ROP decision, make a graph of Ending Inventory for 10 weeks for Food item A. Calculate two 160 Ending Inventories. One for a level demand (i.e., Annual Sales / 50 weeks). One level for high demand of Average weekly sales +1 standard 161 deviation. (Show work and graph below. Have only one graph with two lines on it. Please label it). 162 163 164 13 10 To test the impact of the manager's ROP decision, make a graph of Ending Inventory for 10 weeks for Food item C. Calculate two 165 Ending Inventories. One for a level demand (i.e., Annual Sales / 50 weeks). One level for high demand of Average weekly sales +1 standard 166 deviation. (Show work and graph below. Have only one graph with two lines on it. Please label it). 167 168 169 14 5 Based on the two graphs above, state your conclusion about the ordering policies of this manager. Explain your conclusion. 170 B 25 $203 12 171 172
Step by Step Solution
There are 3 Steps involved in it

Get step-by-step solutions from verified subject matter experts