

Question: . Question QUESTION 6 In the Spring term, the statistics for student scores on Midterm 1 and average coul Grades were as follows: Midterm 1
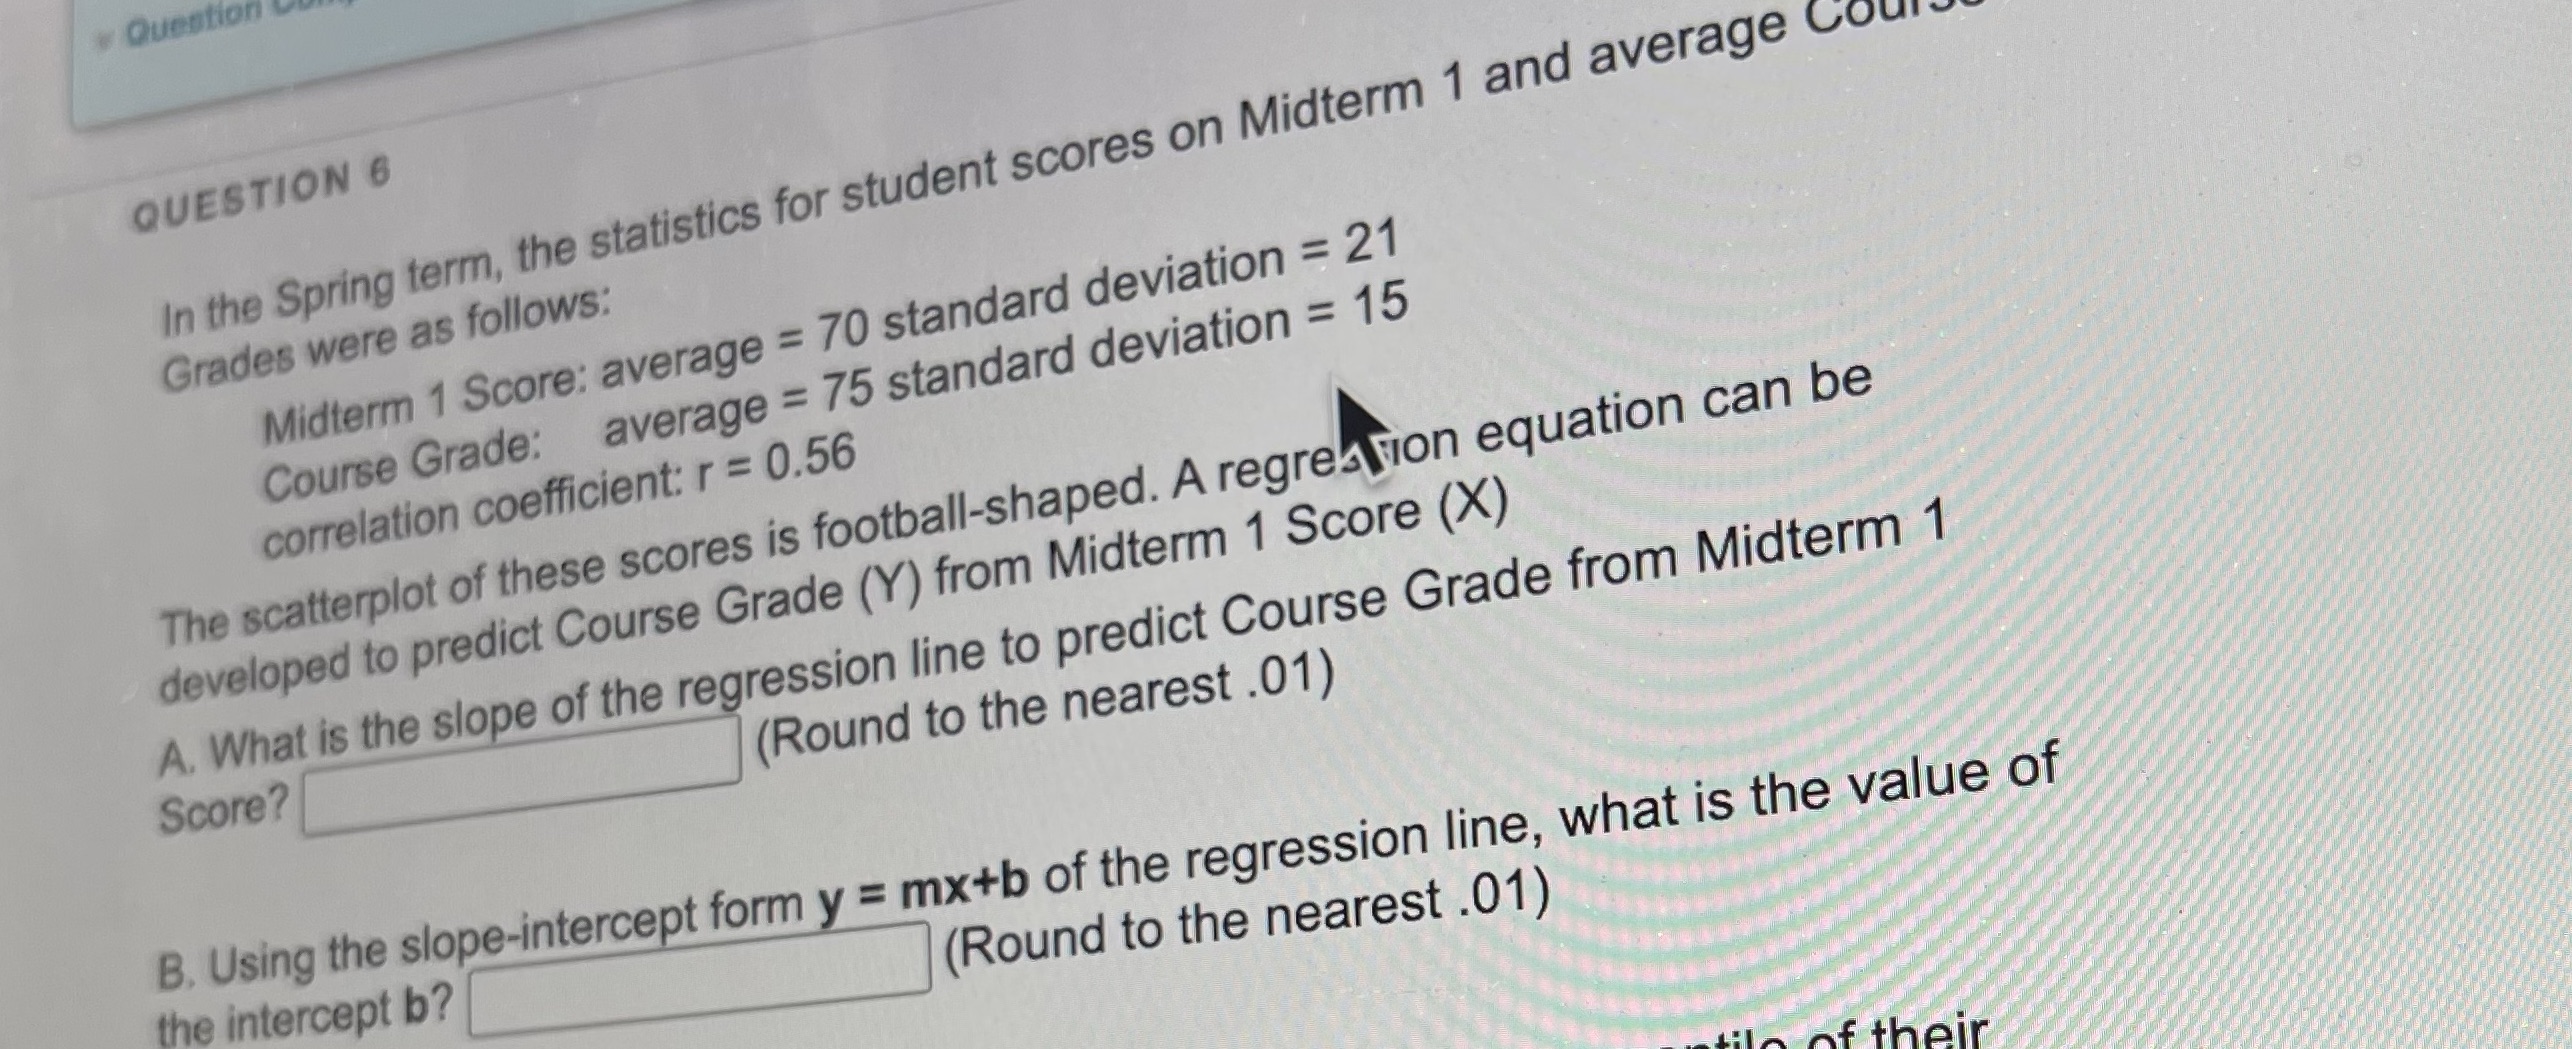
. Question QUESTION 6 In the Spring term, the statistics for student scores on Midterm 1 and average coul Grades were as follows: Midterm 1 Score: average = 70 standard deviation = 21 Course Grade: average = 75 standard deviation = 15 correlation coefficient: r = 0.56 The scatterplot of these scores is football-shaped. A regression equation can be developed to predict Course Grade (Y) from Midterm 1 Score (X) A. What is the slope of the regression line to predict Course Grade from Midterm 1 Score? (Round to the nearest . 01) the intercept b? B. Using the slope-intercept form y = mx+b of the regression line, what is the value of (Round to the nearest .01) of their
Step by Step Solution
There are 3 Steps involved in it

Get step-by-step solutions from verified subject matter experts