

Question: question question Assume that the graph below shows a normal curve for a popular standardized test, the scores of which are normally distributed. .35'l3
question
question
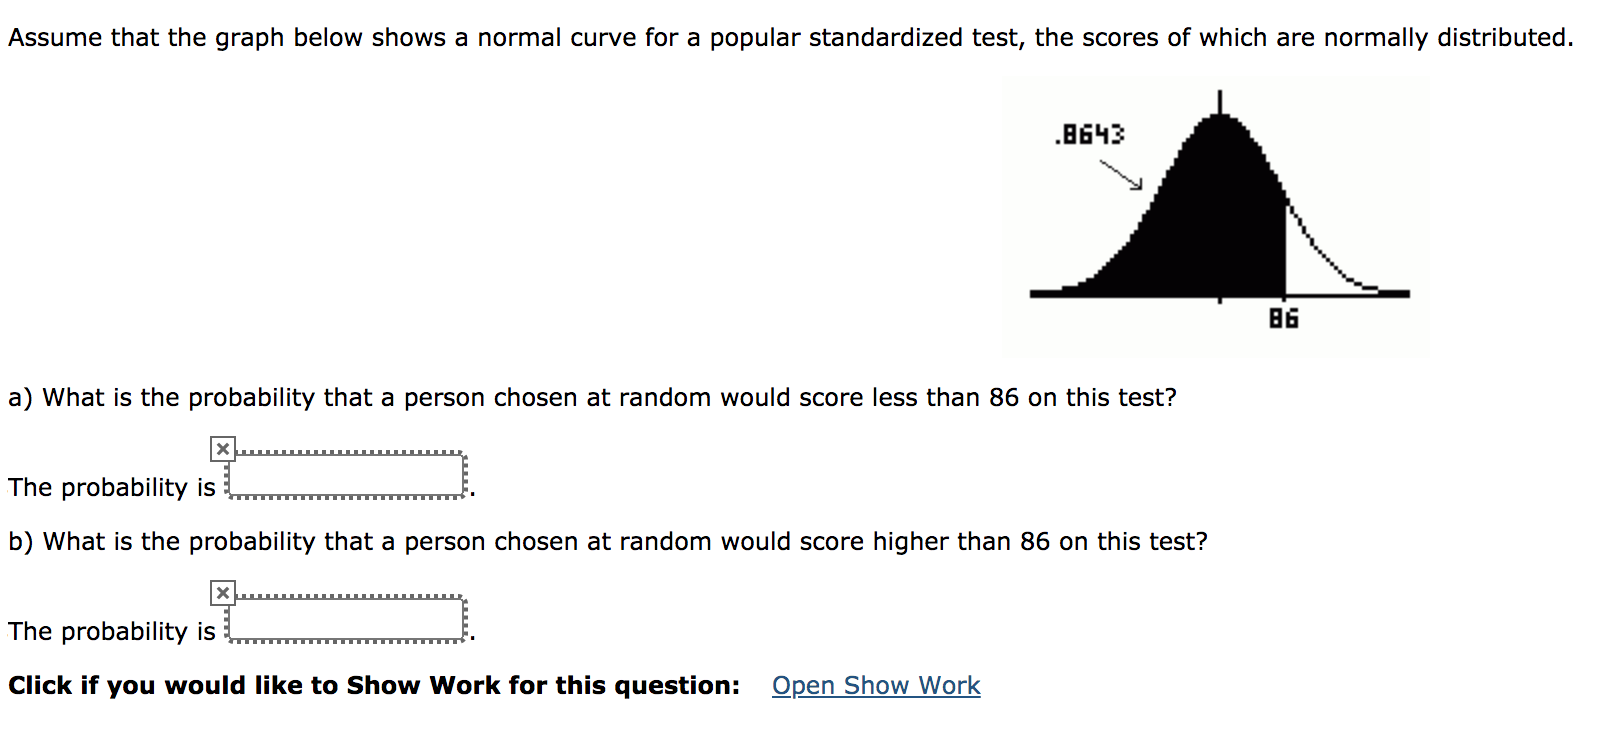
Assume that the graph below shows a normal curve for a popular standardized test, the scores of which are normally distributed. .35'l3 \\ a) What is the probability that a person chosen at random would score less than 86 on this test? b) What is the probability that a person chosen at random would score higher than 86 on this test? Click if you would like to Show Work for this question: Qpen Show Work
Step by Step Solution
There are 3 Steps involved in it
1 Expert Approved Answer
Step: 1 Unlock

Question Has Been Solved by an Expert!
Get step-by-step solutions from verified subject matter experts
Step: 2 Unlock
Step: 3 Unlock