

Question: Question Question D Question 1 Question 8 2 pts Time Running: Hide The histogram below displays the birth rates (# of births per 1000 people)
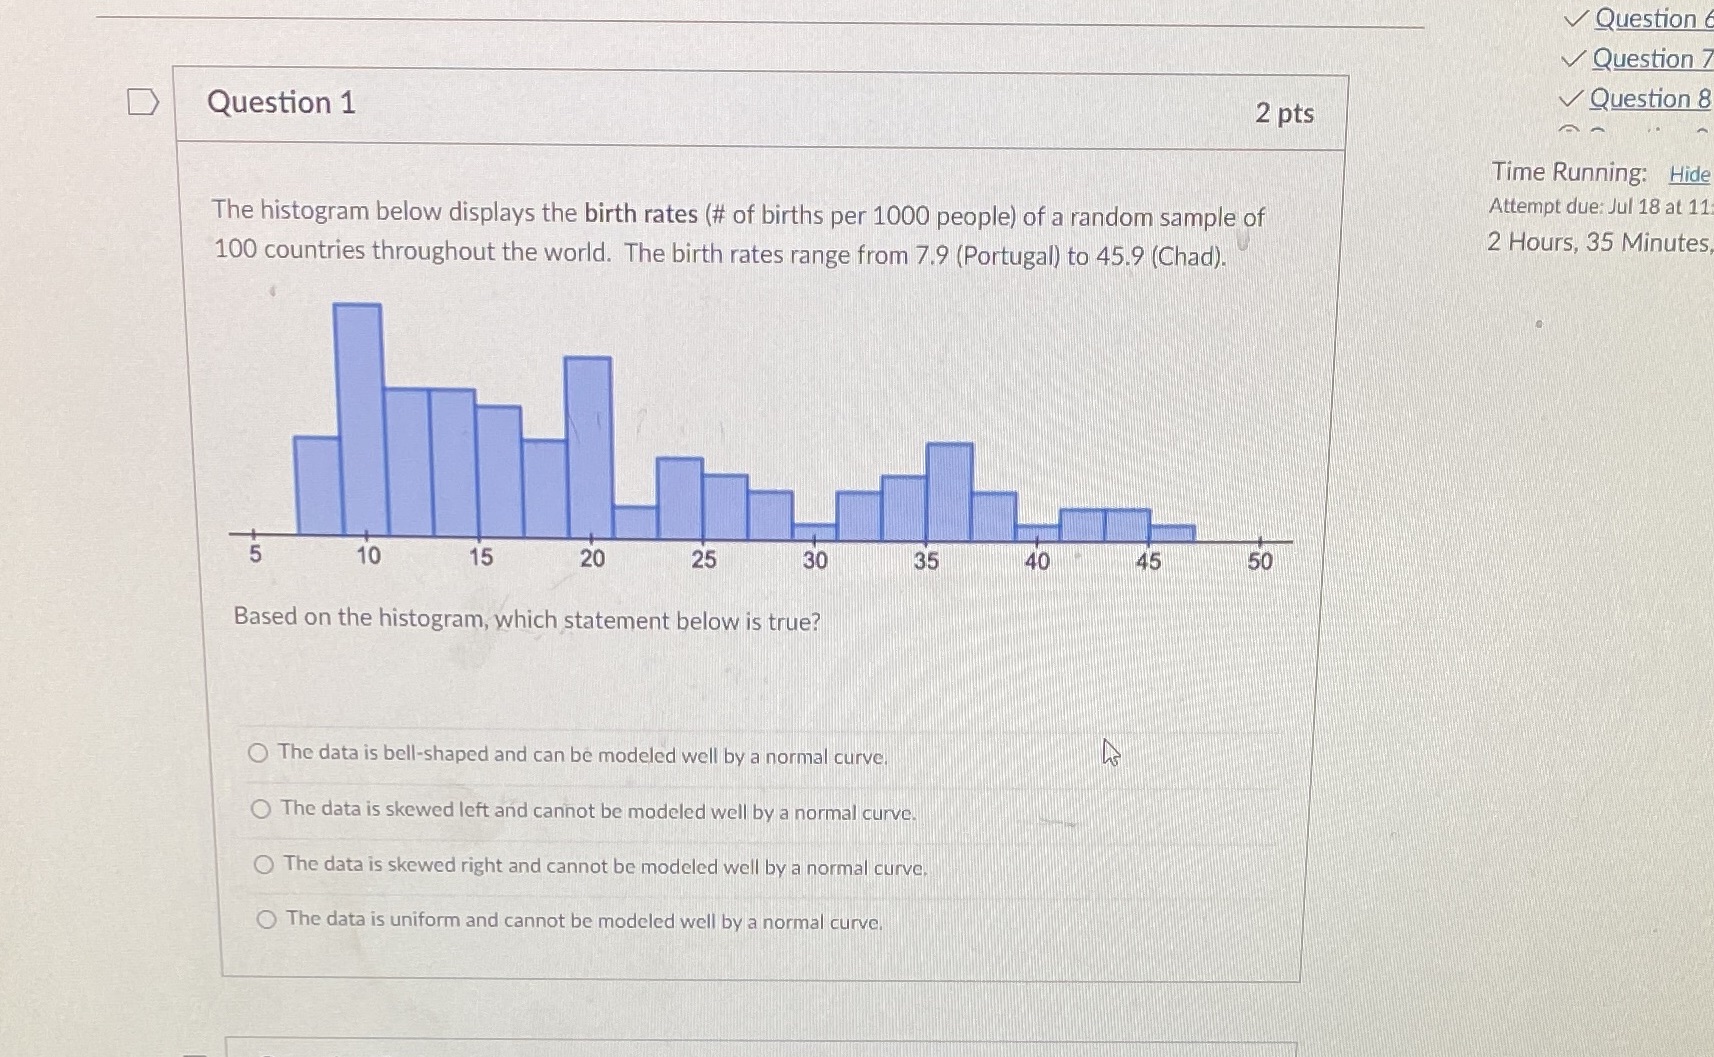
Question Question D Question 1 Question 8 2 pts Time Running: Hide The histogram below displays the birth rates (# of births per 1000 people) of a random sample of Attempt due: Jul 18 at 11 100 countries throughout the world. The birth rates range from 7.9 (Portugal) to 45.9 (Chad). 2 Hours, 35 Minutes, 10 15 20 25 30 35 40 45 50 Based on the histogram, which statement below is true? The data is bell-shaped and can be modeled well by a normal curve The data is skewed left and cannot be modeled well by a normal curve. The data is skewed right and cannot be modeled well by a normal curve. The data is uniform and cannot be modeled well by a normal curve
Step by Step Solution
There are 3 Steps involved in it

Get step-by-step solutions from verified subject matter experts