

Question: Question: research question using the General Social Survey dataset that can be answered by multiple regression. Using the SPSS software, choose a categorical variable to
Question:
research question using the General Social Survey dataset that can be answered by multiple regression. Using the SPSS software, choose a categorical variable to dummy code as one of your predictor variables. Estimate a multiple regression model that answers your research question. Post your response to the following: What is your research question? Interpret the coefficients for the model, specifically commenting on the dummy variable. Run diagnostics for the regression model. Does the model meet all the assumptions? Be sure and comment on what assumptions were not met and the possible implications. Is there any possible remedy for one the assumption violations?
1. Research Question(Must contain a categorical IV in order for this work).
2. Null and Alternative Hypothesis.
3. Variables and Dummy Variable (the dummy variable used and how it was changed for this week's multiple regression).
2. Give each assumption and show it was met:
a.Durbin-Watson's (independence of error), what's the value and what does this mean?
b. The full ANOVA (was the test significant?)
c. VIF (to diagnose collinearity), what is the value and what does this mean?
d. Cooks distance (to test undue influence), what is the value and does this mean here?
e. Normal Distribution as per the histogram, explain what it means.
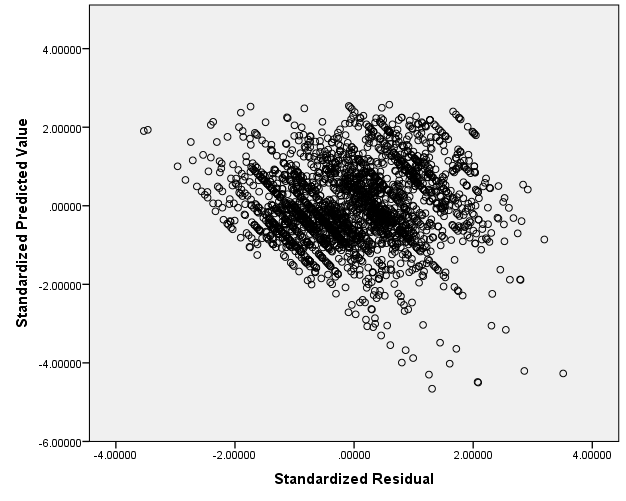
f.Heteroscedasticityand Linearity - thescatterplot,explain what both of these mean and how thescatterplotshows both.
3. Now, finish themultipleregression information:
a. The ANOVA hasalready been discussed, but re-mention to continue this analysis.
b. The R and R-squared and what they both mean.
c. The coefficient p-values and what this means and the overall coefficient equation.
4. Follow with abrief conclusion.
signment):
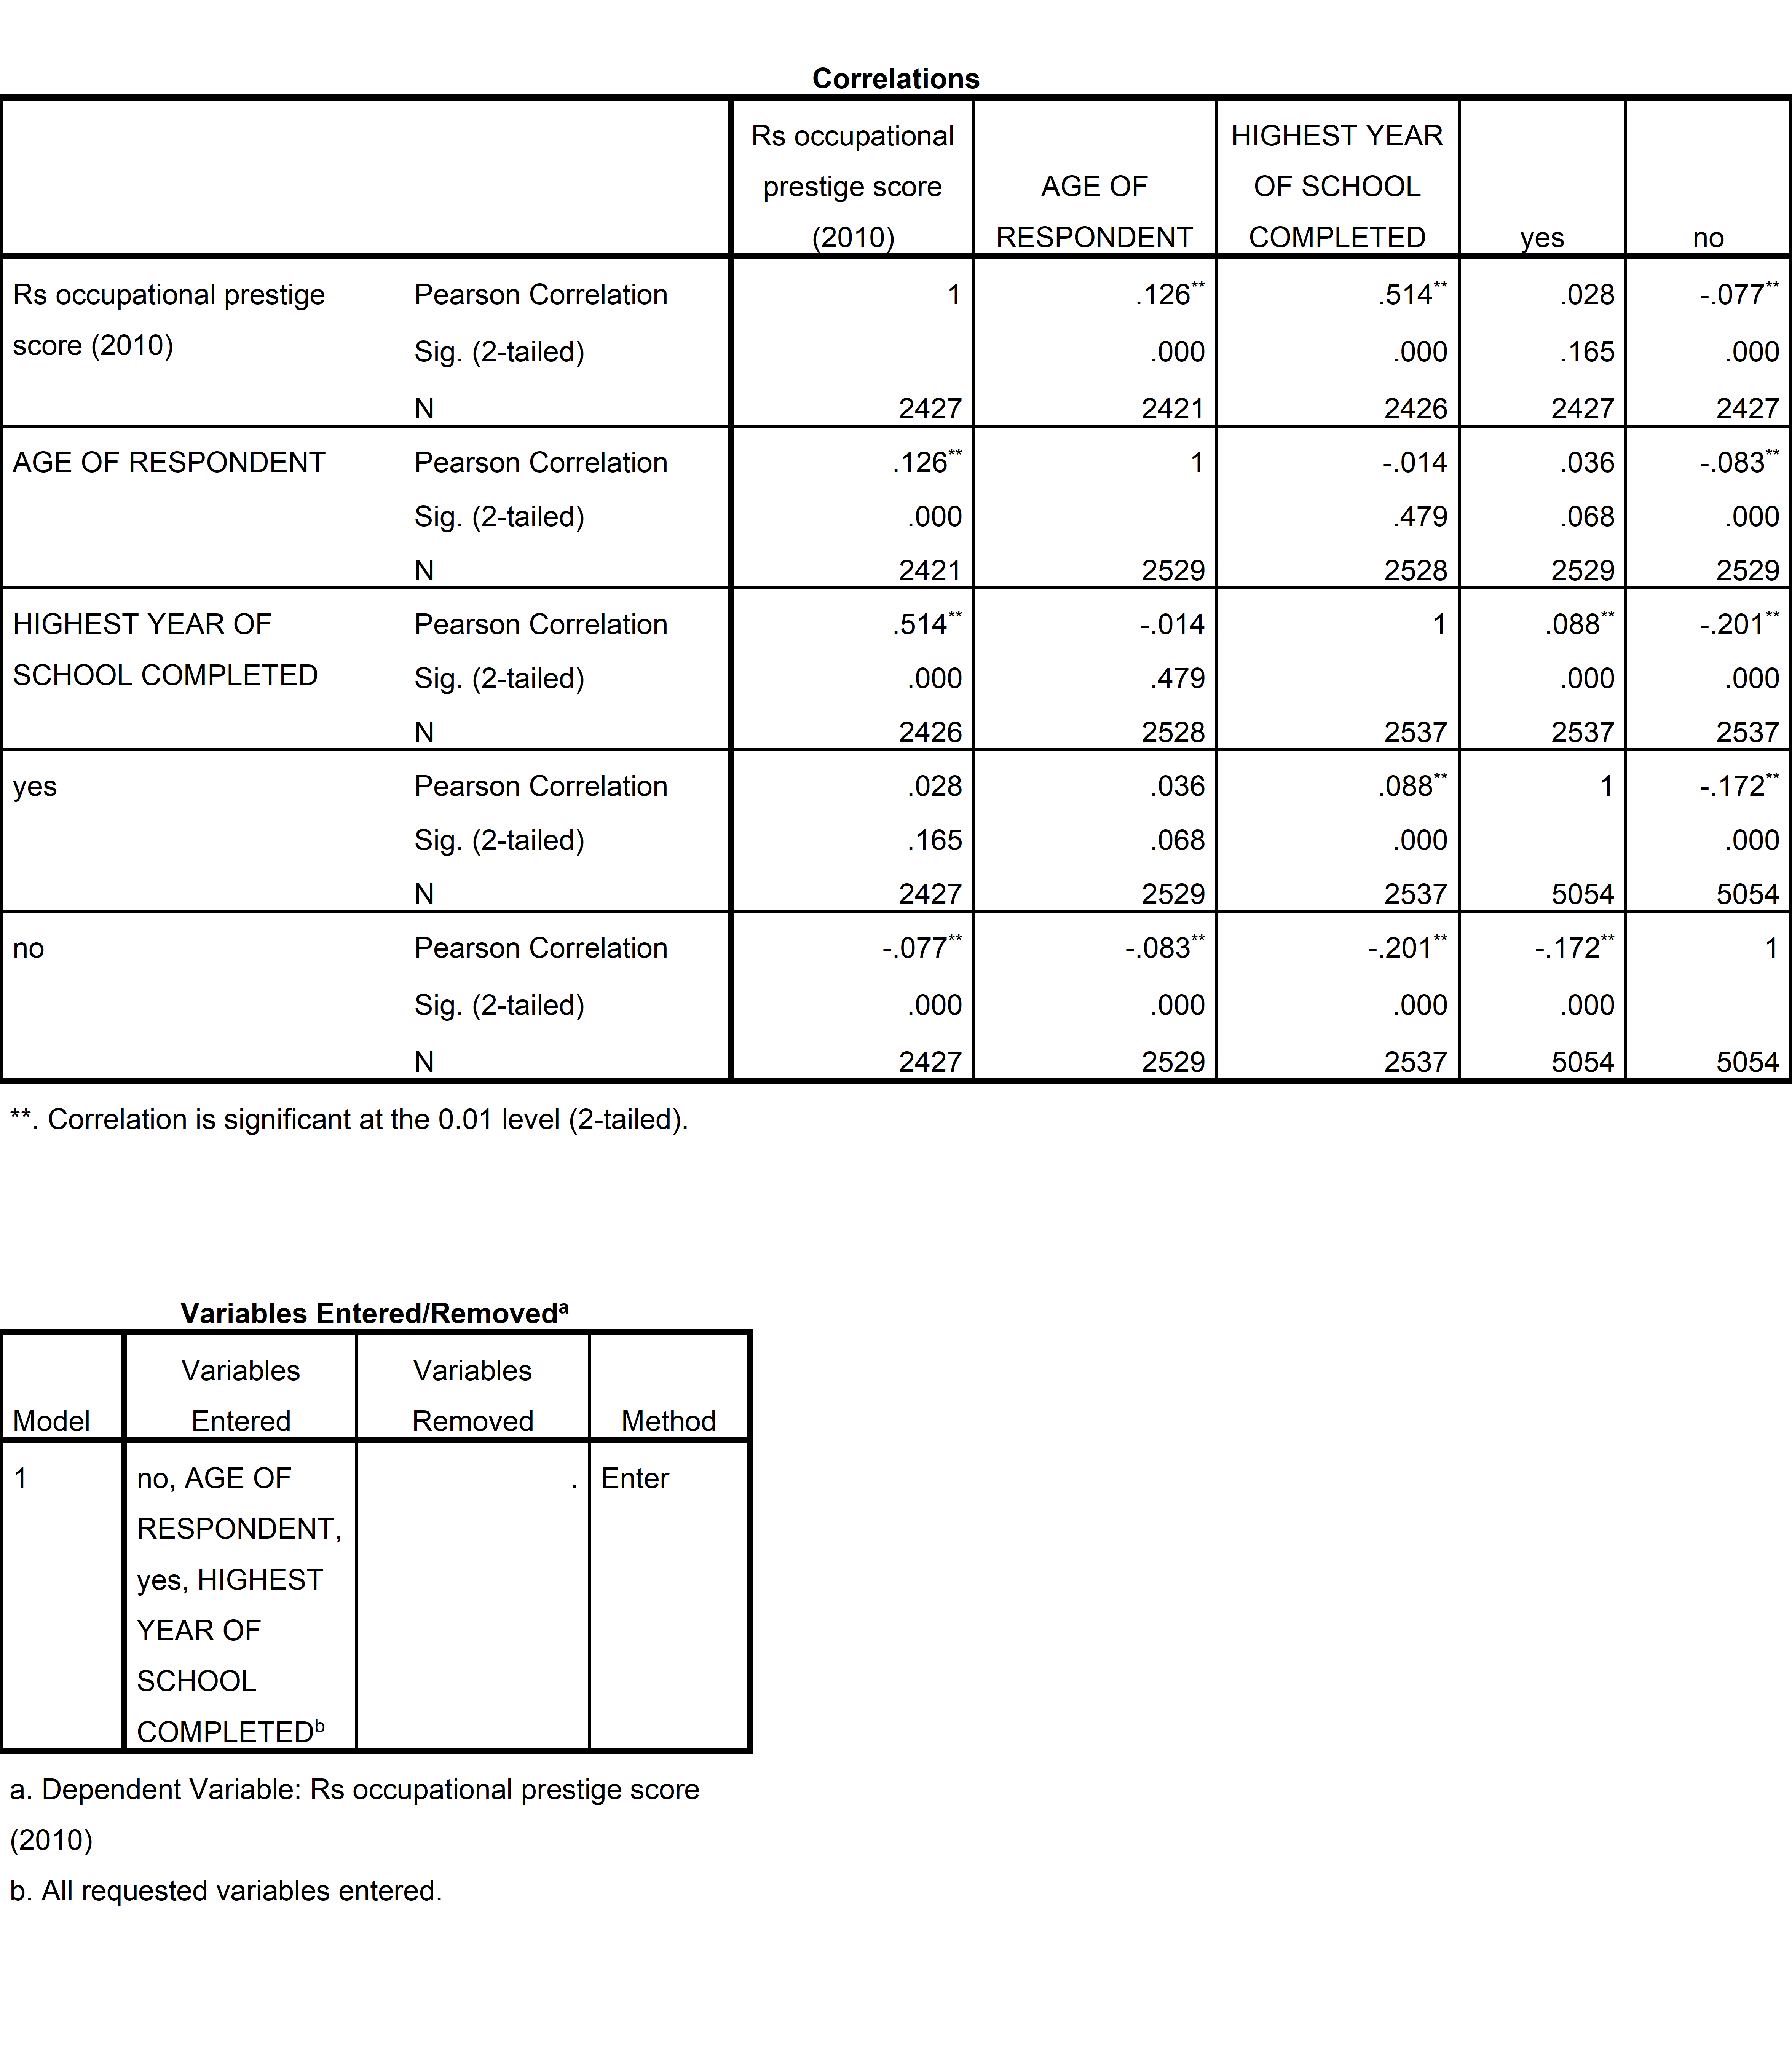
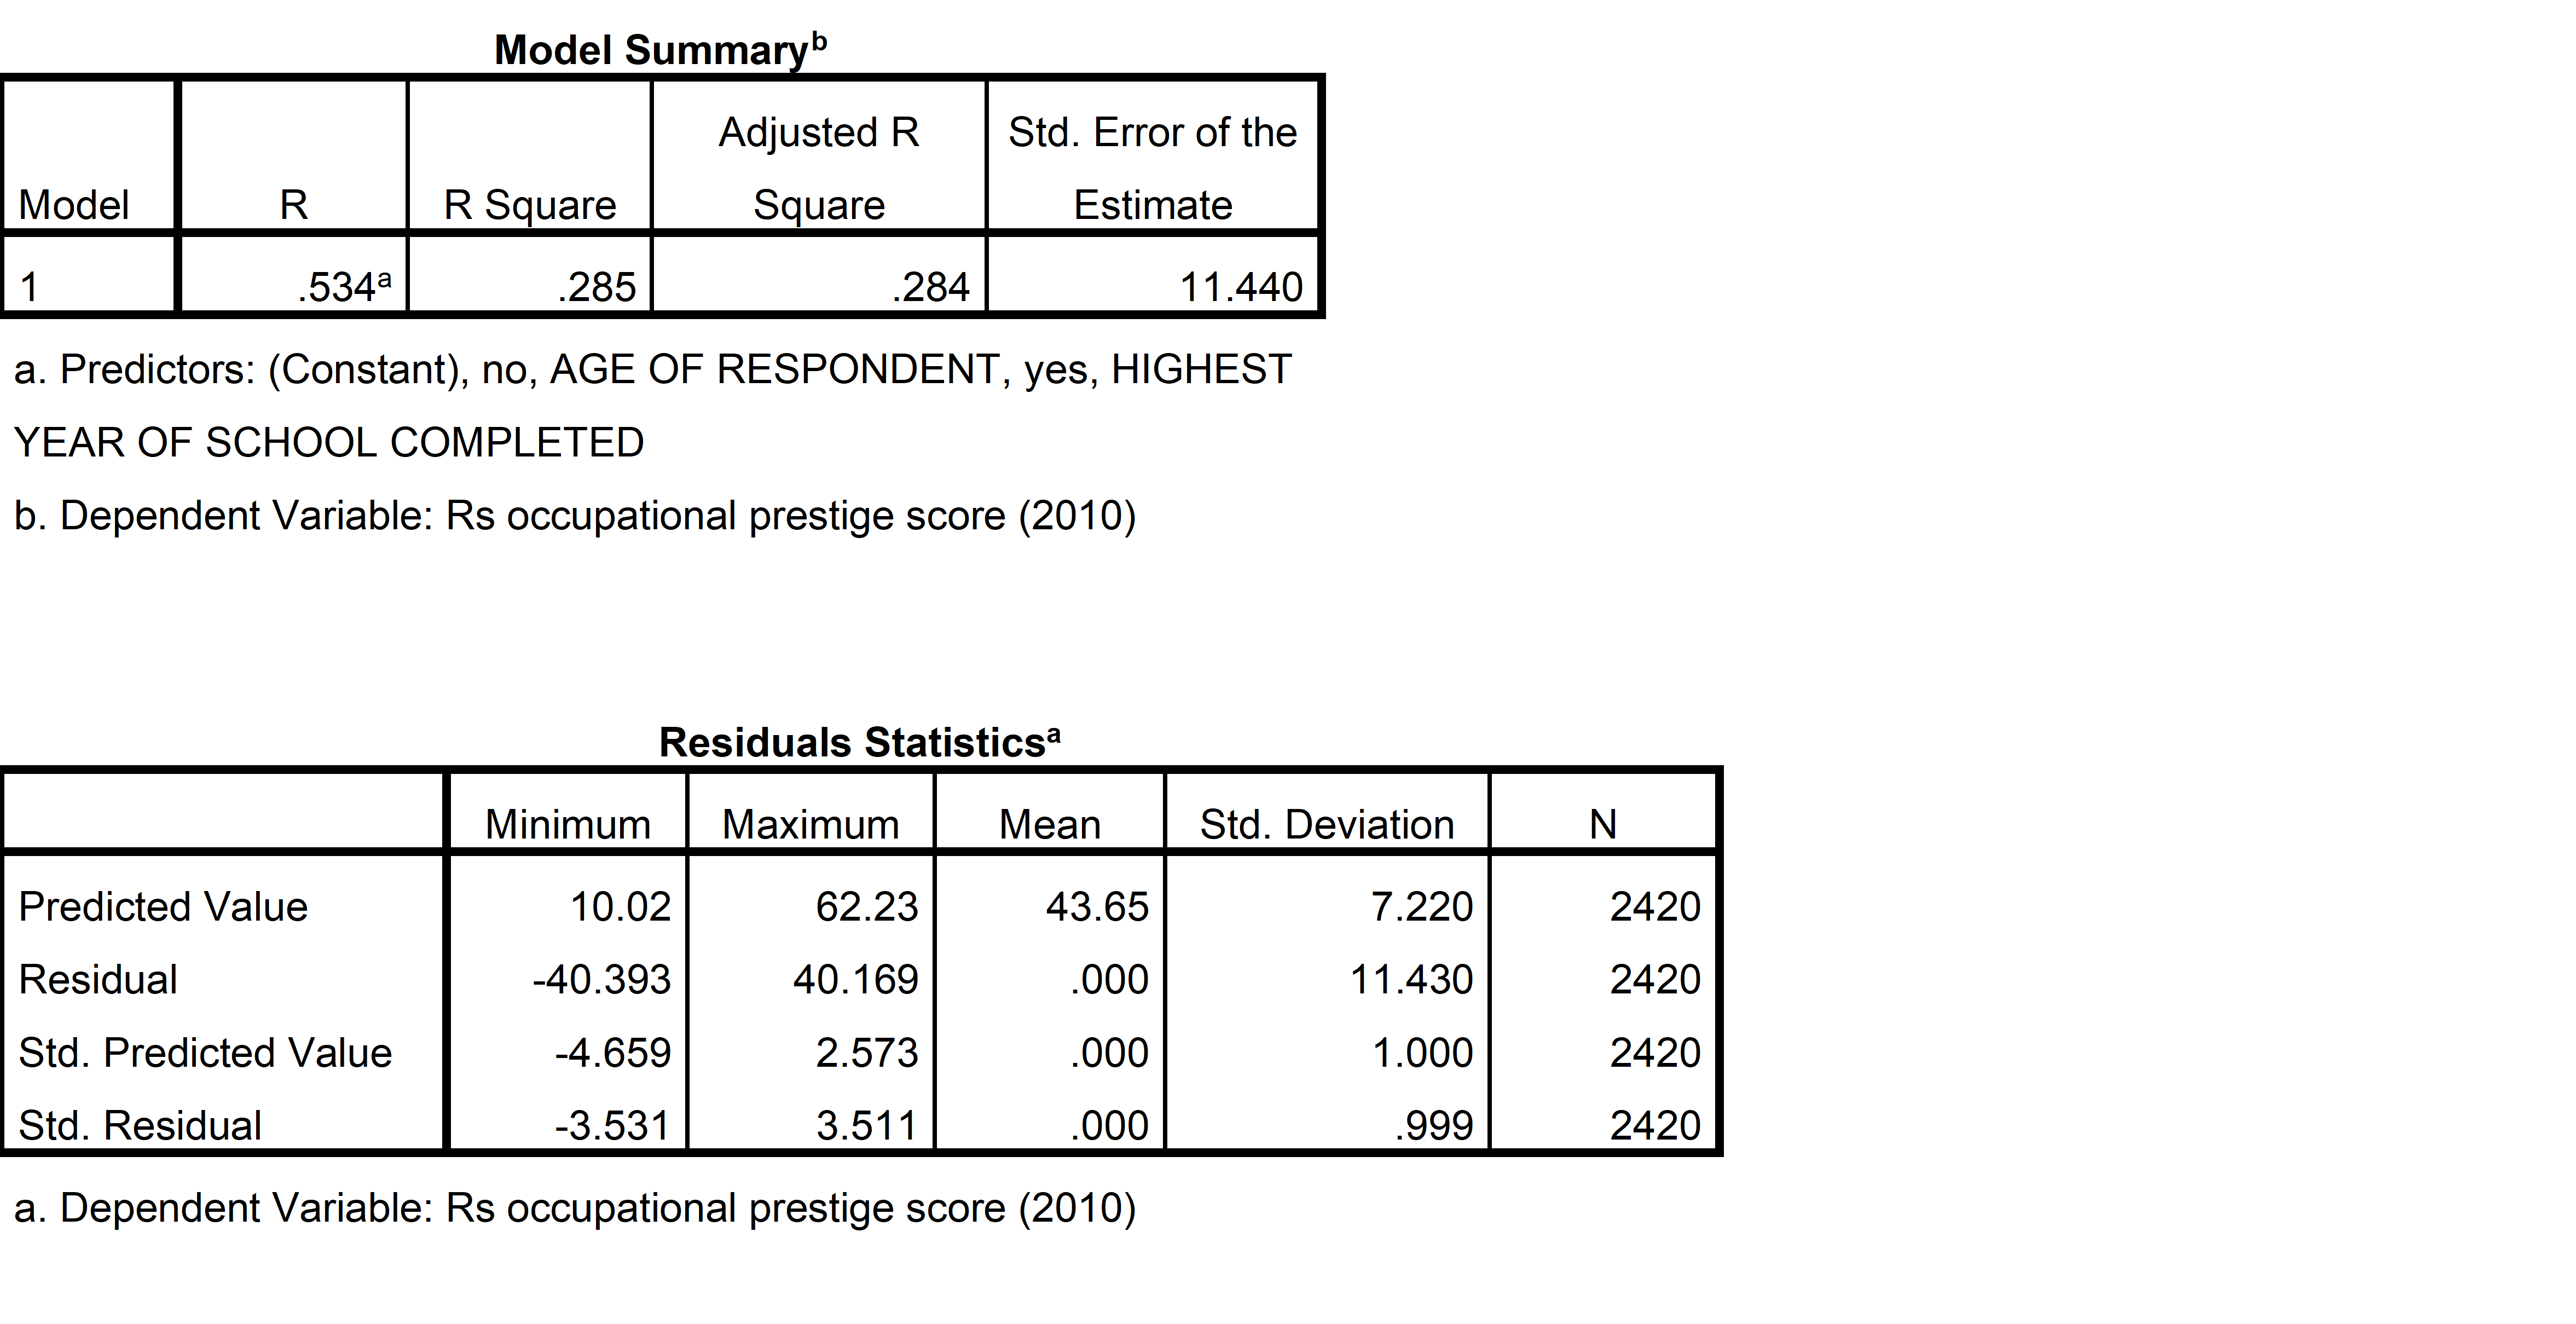
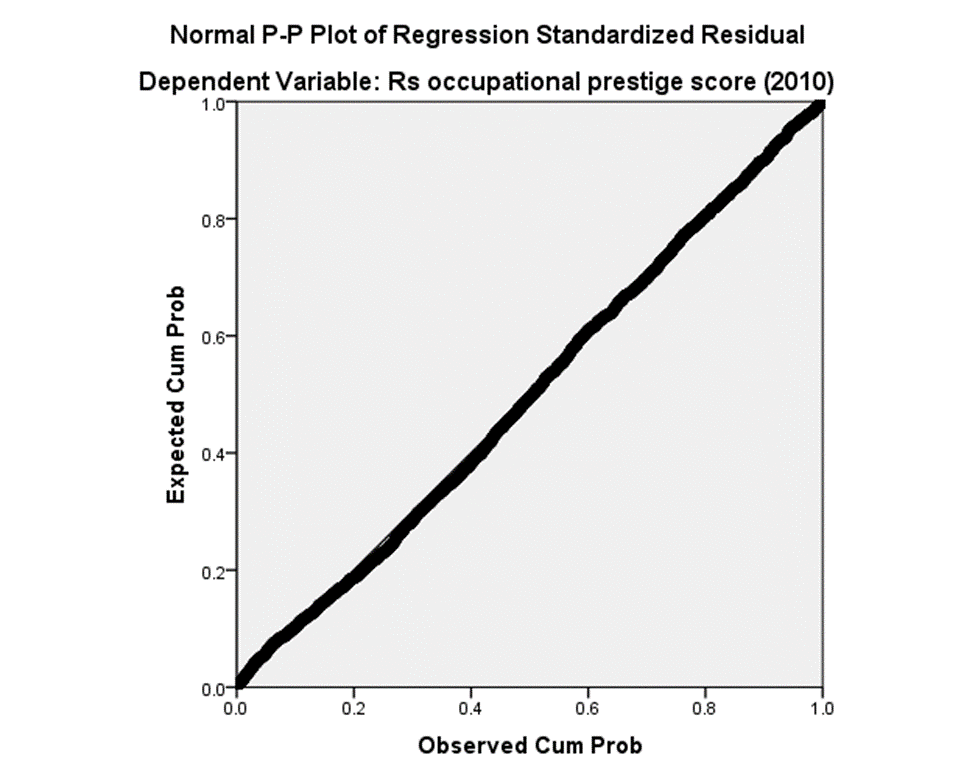
Correlations Rs occupational HIGHEST YEAR prestige score AGE OF OF SCHOOL (2010) RESPONDENT COMPLETED yes no Rs occupational prestige Pearson Correlation 126* 514** 028 .077 score (2010) Sig. (2-tailed) .000 000 165 00 N 2427 2421 2426 2427 2427 AGE OF RESPONDENT Pearson Correlation 126* .014 03 .083 Sig. (2-tailed) 479 890 N 2421 2529 2528 2529 529 HIGHEST YEAR OF Pearson Correlation 514* -.014 088* -.201 SCHOOL COMPLETED Sig. (2-tailed) 000 479 000 000 N 2426 2528 2537 2537 53 yes Pearson Correlation 028 036 088 . 172 Sig. (2-tailed) 165 068 N 427 2529 2537 5054 1054 no Pearson Correlation .077* -.083* .201* -. 172** Sig. (2-tailed) 000 0OC 000 N 2427 2529 2537 5054 5054 **. Correlation is significant at the 0.01 level (2-tailed). Variables Entered/Removeda Variables Variables Model Entered Removed Method 1 no, AGE OF Enter RESPONDENT, yes, HIGHEST YEAR OF SCHOOL COMPLETED a. Dependent Variable: Rs occupational prestige score (2010 b. All requested variables entered.Model Summaryb Adjusted R Std. Error of the Model R R Square Square Estimate 534a 285 284 11.440 a. Predictors: (Constant), no, AGE OF RESPONDENT, yes, HIGHEST YEAR OF SCHOOL COMPLETED b. Dependent Variable: Rs occupational prestige score (2010) Residuals Statistics Minimum Maximum Mean Std. Deviation N Predicted Value 10.02 62.23 43.65 7.220 2420 Residual -40.393 40. 169 000 11.430 2420 Std. Predicted Value -4.659 2.573 000 1.000 2420 Std. Residual -3.531 3.511 000 999 2420 a. Dependent Variable: Rs occupational prestige score (2010)Normal P-P Plot of Regression Standardized Residual Dependent Variable: Rs occupational prestige score (2010) 1.0 0.8 Expected Cum Prob 0.2 no 02 04 no 03 1o Observed Cum Prob \f
Step by Step Solution
There are 3 Steps involved in it

Get step-by-step solutions from verified subject matter experts