

Question: Question: Scientists are interested in predicting the cancer volume (in mm3) from a blood marker measurement for patients who are known to have prostate cancer.
Question:
Scientists are interested in predicting the cancer volume (in mm3) from a blood marker measurement for patients who are known to have prostate cancer. The file prostate.csv contain the blood marker measurement and cancer volume for 200 prostate cancer pa- tients.
(a) Identify the independent and dependent variable in this experiment.
(b) Load the dataset into Python and create a
appropriate graphical summary of the data. Describe the plot.
(c) Compute the correlation coefficient between the cancer volume and the blood marker measurement. Does this indicate a strong or weak linear relationship? Is the rela- tionship positive or negative?
(d) Fit a linear regression model to the data. Describe the fitted relationship.
(e) A new prostate cancer patient arrive at the clinic with a blood marker measurement
of 4.3 mm3. Use the fitted model to predict the cancer volume for this patient.
(f) Examine the model residuals to determine if the assumptions about the random
component of the linear regression model are met.
(g) After reviewing the data, the scientists realise that their equipment is inaccurate for blood marker measurements below 1. As such, patients with a blood marker measurement of less than 1 must be removed from the analysis. Remove these patients from the dataset and do analysis. Does this improve the model fit? Explain your reasoning.
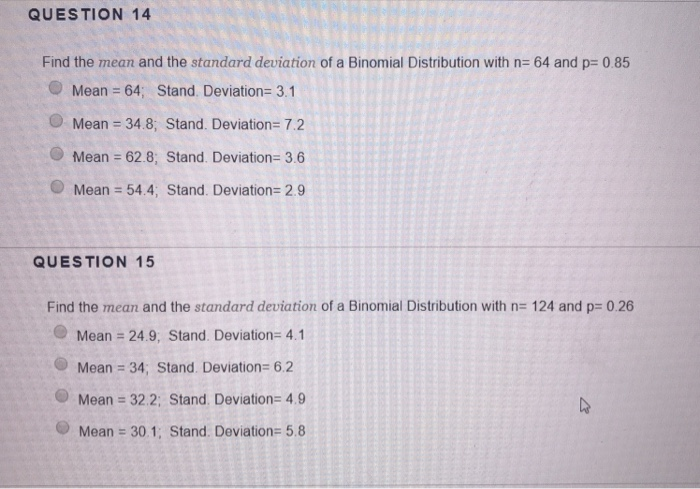
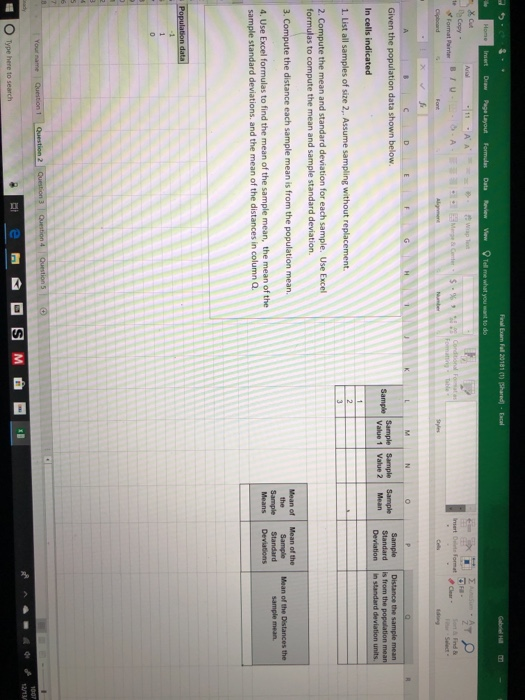
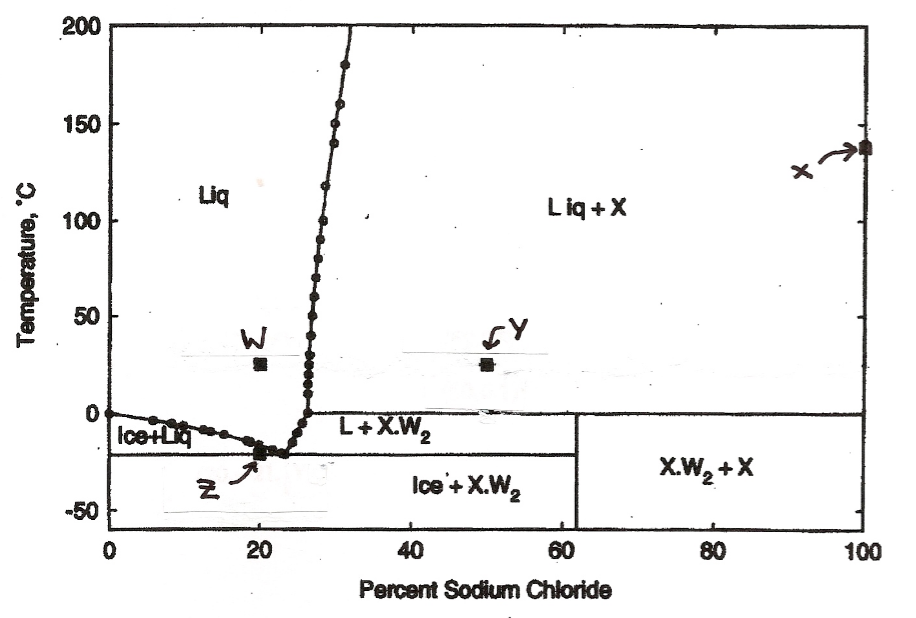
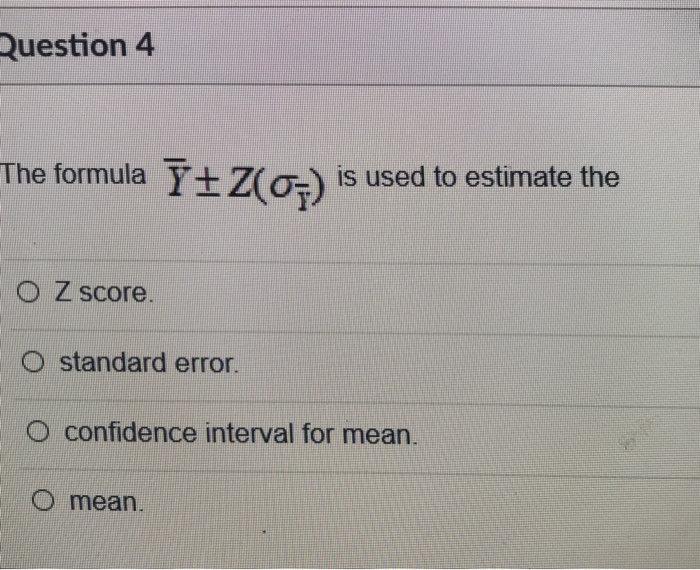
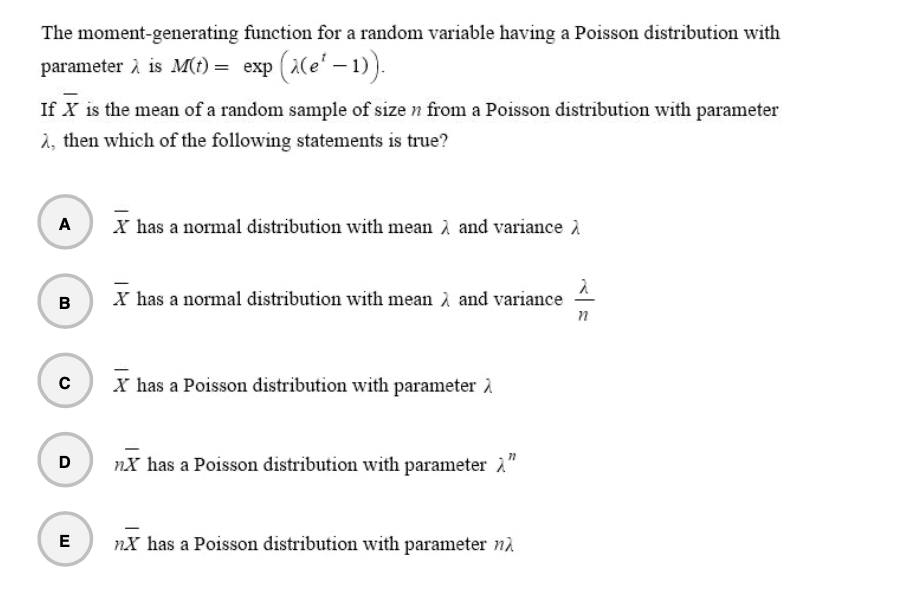
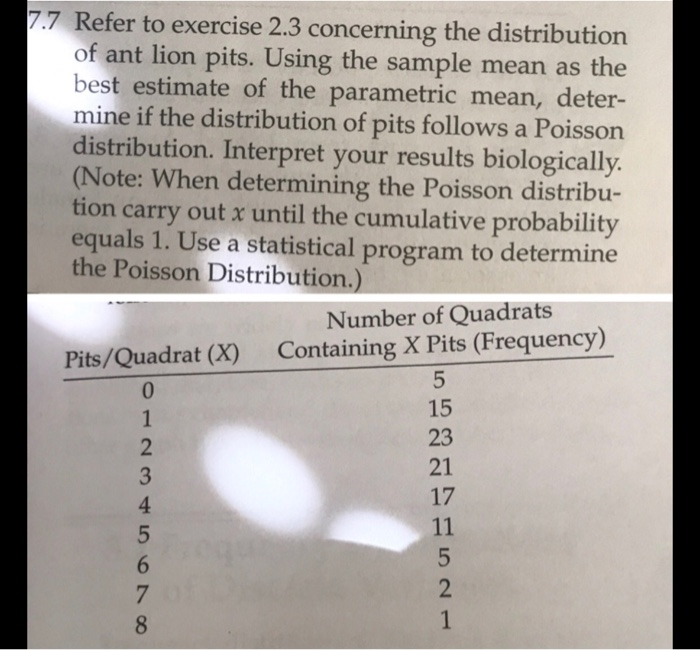
QUESTION 14 Find the mean and the standard deviation of a Binomial Distribution with n= 64 and p= 0.85 O Mean = 64; Stand. Deviation= 3.1 Mean = 34.8, Stand. Deviation= 7.2 Mean = 62.8; Stand. Deviation= 3.6 Mean = 54.4; Stand. Deviation= 2.9 QUESTION 15 Find the mean and the standard deviation of a Binomial Distribution with n= 124 and p= 0.26 Mean = 24.9; Stand. Deviation= 4.1 Mean = 34; Stand. Deviation= 6.2 Mean = 32.2; Stand, Deviation= 4.9 Mean = 30.1; Stand. Deviation= 5.8Final Exam Fell 20181 (1) (thannon - Excel Page Layout Formals Dais Review Wow ) Tell me what you want to do & Cut - 11 KA To Copy - Format Painin Conditional Fordates mart Delvin Format Four & Fired .& Formating= Table Font G Given the population data shown below. Sample Sample Sample |Sample Sample Distance the sample mean Value 1 Standard Value 2 Mann Is from the population moan In cells indicated Deviation In standard deviation units, 1. List all samples of size 2,. Assume sampling without replacement. 2. Compute the mean and standard deviation for each sample. Use Excel formulas to compute the mean and sample standard deviation. 3. Compute the distance each sample mean is from the population mean, Moan of Mean of the the Man of the Distances the Sample Standard sample mean. 4. Use Excel formulas to find the mean of the sample mean, the mean of the Moans Devitoing sample standard deviations. and the mean of the distances in column Q Population data Your name Duration 1 Question 2 Question 3 | Question 4 |Question S Type here to search200 150 X Liq 100 Lig + X Temperature, 'C 50 W 0 Ice+Lig L+ X.W 2 Ice + X.W. X.W2 + X 2 -50 20 40 60 80 100 Percent Sodium ChlorideQuestion 4 The formula Yt Z(o=) is used to estimate the O Z score. standard error. confidence interval for mean O mean.The moment-generating function for a random variable having a Poisson distribution with parameter A is ME!) = en} [Her 1)). If 1! is the mean of a random sample of size n from a Poisson distribution with parameter .1, than which of the following statements is true? G) E has a normal distribution with mean A and variance ,1 E has a normal distribution with mean .1 and variance % G E has a Poisson distribution with parameter ,1 Q n} has a Poisson distribution with parameter .1" G n} has a Poisson distribution we parameter ni 7.7 Refer to exercise 2.3 concerning the distribution of ant lion pits. Using the sample mean as the best estimate of the parametric mean, deter- mine if the distribution of pits follows a Poisson distribution. Interpret your results biologically. (Note: When determining the Poisson distribu- tion carry out x until the cumulative probability equals 1. Use a statistical program to determine the Poisson Distribution.) Number of Quadrats Pits/Quadrat (X) Containing X Pits (Frequency) 5 15 23 DO YOUTAWNHO
Step by Step Solution
There are 3 Steps involved in it

Get step-by-step solutions from verified subject matter experts