Question: Question: Strength Examples Opportunity For Improvement Examples Rational & Resolution How does the organization design their product and service processes to meet customer requirements? Category
| Question: | Strength Examples | Opportunity For Improvement Examples | Rational & Resolution |
| How does the organization design their product and service processes to meet customer requirements? | | | |
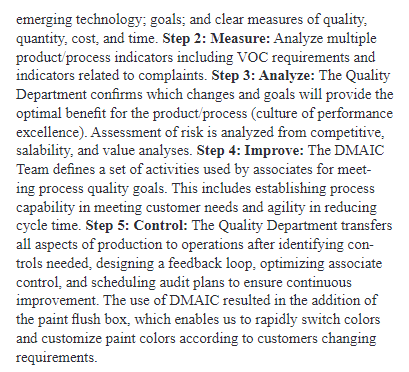
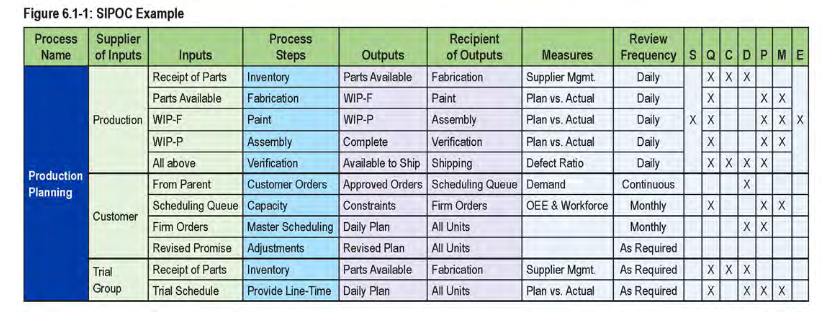
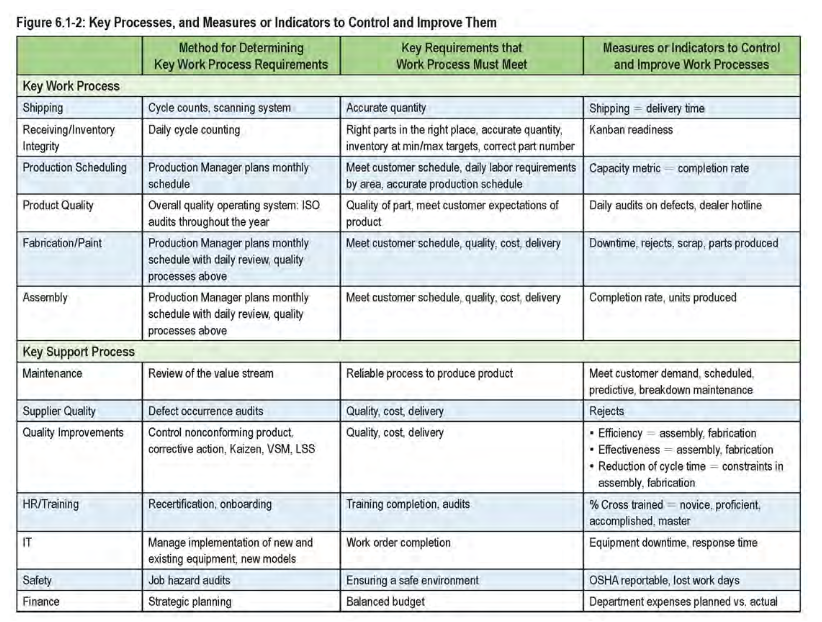
Category 6: Operations 6.1 Work Processes 6.1a Product and Process Design 6.1a(1) GG determines key product and work process requirements by placing emphasis on product attributes (developed from feedback gained from dealers listening to the VOC (see Figure 4.2-3] and the blueprint provided by corporate that includes market data that leads to customer satisfaction and preference). We use the Kano model, a 2015 improvement, as a framework to categorize and prioritize the different performance features of our products based on VOC. We map this input in a CTQ tree, a 2016 improvement, to provide clarity and structure for developing quantifiable process specifications. Design quality is the downstream driver of quality, which includes concept-to-customer times, time for design, development, production and delivery of new mowers. We focus on continuous improvement and corrective action as far upstream as possible for the greatest savings and collabo- rate with the Corporate Design Team on every innovation and new model. 6.1a(2) Our key work processes (Figure 6.1-2) are created from SIPOCs (available on-site), so that all stakeholders understand our core processes and their requirements. Figure 6.1-1 shows a SIPOC example. 6.1a(3) GG uses DMADV/DMAIC as a structured process for developing products and work processes to ensure that customer needs are met. We incorporate Lean tools and methods for the particular product being developed and deliv- ered. Step 1: Define: Identify new work processes based on cross-functional team recommendations. The diversity of team members ensures a working knowledge of the product and processes throughout the plant. The Quality Department keeps the DMADV/DMAIC process on track, evaluates progress on each tollgate, and makes midcourse corrections based on emerging technology: goals; and clear measures of quality, quantity, cost, and time. Step 2: Measure: Analyze multiple product/process indicators including VOC requirements and indicators related to complaints. Step 3: Analyze: The Quality Department confirms which changes and goals will provide the optimal benefit for the product process (culture of performance excellence). Assessment of risk is analyzed from competitive, salability, and value analyses. Step 4: Improve: The DMAIC Team defines a set of activities used by associates for meet- ing process quality goals. This includes establishing process capability in meeting customer needs and agility in reducing cycle time. Step 5: Control: The Quality Department transfers all aspects of production to operations after identifying con- trols needed, designing a feedback loop, optimizing associate control and scheduling audit plans to ensure continuous improvement. The use of DMAIC resulted in the addition of the paint flush box, which enables us to rapidly switch colors and customize paint colors according to customers changing requirements. Figure 6.1-1: SIPOC Example Process Supplier Process Recipient Name of Inputs Inputs Steps Outputs of Outputs Measures Receipt of Parts Inventory Parts Available Fabrication Supplier Mgmt Parts Available Fabrication WIP-F Paint Plan vs. Actual Production WIP-F Paint WIP-P Assembly Plan vs. Actual WIP-P Assembly Complete Verification Plan vs. Actual All above Verification Available to Ship Shipping Defect Ratio Production Planning From Parent Customer Orders Approved Orders Scheduling Queue Demand Scheduling Queue Capacity Constraints Firm Orders OEE & Workforce Customer Firm Orders Master Scheduling Daily Plan All Units Revised Promise Adjustments Revised Plan All Units Trial Receipt of Parts Inventory Parts Available Fabrication Supplier Mgmt Group Trial Schedule Provide Line-Time Daily Plan All Units Plan vs. Actual Review Frequency S QCDPME Daily [X X X Daily XX Daily XX XXX Daily XX Daily |X| XXX Continuous X Monthly |XX Monthly | xx As Required As Required XXX As Required X XXX Figure 6.1-2: Key Processes, and Measures or Indicators to Control and Improve Them Method for Determining Key Requirements that Measures or Indicators to Control Key Work Process Requirements Work Process Must Meet and improve Work Processes Key Work Process Shipping Cycle counts, scanning system Accurate quantity Shipping = delivery time Receiving/Inventory Daily cycle counting Right parts in the right place, accurate quantity Kanban readiness Integrity inventory at min/max targets, correct part number Production Scheduling Production Manager plans monthly Meet customer schedule, daily labor requirements Capacity metric - completion rate schedule by area, accurate production schedule Product Quality Overall quality operating system: ISO Quality of part, meet customer expectations of Daily audits on defects, dealer hotline audits throughout the year product Fabrication/Paint Production Manager plans monthly Meet customer schedule, quality, cost delivery Downtime, rejects, scrap, parts produced schedule with daily review, quality processes above Assembly Production Manager plans monthly Meet customer schedule, quality cost delivery Completion rate, units produced schedule with daily review, quality processes above Key Support Process Maintenance Review of the value stream Reliable process to produce product Meet customer demand, scheduled, predictive, breakdown maintenance Supplier Quality Defect occurrence audits Quality, cost, delivery Rejects Quality Improvements Control nonconforming product, Quality, cost delivery Efficiency = assembly, fabrication corrective action, Kaizen, VSM, LSS Effectiveness assembly, fabrication Reduction of cycle time = constraints in assembly, fabrication HR/Training Recertification, onboarding Training completion audits % Cross trained novice proficient, accomplished, master IT Manage implementation of new and Work order completion Equipment downtime, response time existing equipment, new models Safety Job hazard audits Ensuring a safe environment OSHA reportable, lost work days Finance Strategic planning Balanced budget Department expenses planned vs. actual Category 6: Operations 6.1 Work Processes 6.1a Product and Process Design 6.1a(1) GG determines key product and work process requirements by placing emphasis on product attributes (developed from feedback gained from dealers listening to the VOC (see Figure 4.2-3] and the blueprint provided by corporate that includes market data that leads to customer satisfaction and preference). We use the Kano model, a 2015 improvement, as a framework to categorize and prioritize the different performance features of our products based on VOC. We map this input in a CTQ tree, a 2016 improvement, to provide clarity and structure for developing quantifiable process specifications. Design quality is the downstream driver of quality, which includes concept-to-customer times, time for design, development, production and delivery of new mowers. We focus on continuous improvement and corrective action as far upstream as possible for the greatest savings and collabo- rate with the Corporate Design Team on every innovation and new model. 6.1a(2) Our key work processes (Figure 6.1-2) are created from SIPOCs (available on-site), so that all stakeholders understand our core processes and their requirements. Figure 6.1-1 shows a SIPOC example. 6.1a(3) GG uses DMADV/DMAIC as a structured process for developing products and work processes to ensure that customer needs are met. We incorporate Lean tools and methods for the particular product being developed and deliv- ered. Step 1: Define: Identify new work processes based on cross-functional team recommendations. The diversity of team members ensures a working knowledge of the product and processes throughout the plant. The Quality Department keeps the DMADV/DMAIC process on track, evaluates progress on each tollgate, and makes midcourse corrections based on emerging technology: goals; and clear measures of quality, quantity, cost, and time. Step 2: Measure: Analyze multiple product/process indicators including VOC requirements and indicators related to complaints. Step 3: Analyze: The Quality Department confirms which changes and goals will provide the optimal benefit for the product process (culture of performance excellence). Assessment of risk is analyzed from competitive, salability, and value analyses. Step 4: Improve: The DMAIC Team defines a set of activities used by associates for meet- ing process quality goals. This includes establishing process capability in meeting customer needs and agility in reducing cycle time. Step 5: Control: The Quality Department transfers all aspects of production to operations after identifying con- trols needed, designing a feedback loop, optimizing associate control and scheduling audit plans to ensure continuous improvement. The use of DMAIC resulted in the addition of the paint flush box, which enables us to rapidly switch colors and customize paint colors according to customers changing requirements. Figure 6.1-1: SIPOC Example Process Supplier Process Recipient Name of Inputs Inputs Steps Outputs of Outputs Measures Receipt of Parts Inventory Parts Available Fabrication Supplier Mgmt Parts Available Fabrication WIP-F Paint Plan vs. Actual Production WIP-F Paint WIP-P Assembly Plan vs. Actual WIP-P Assembly Complete Verification Plan vs. Actual All above Verification Available to Ship Shipping Defect Ratio Production Planning From Parent Customer Orders Approved Orders Scheduling Queue Demand Scheduling Queue Capacity Constraints Firm Orders OEE & Workforce Customer Firm Orders Master Scheduling Daily Plan All Units Revised Promise Adjustments Revised Plan All Units Trial Receipt of Parts Inventory Parts Available Fabrication Supplier Mgmt Group Trial Schedule Provide Line-Time Daily Plan All Units Plan vs. Actual Review Frequency S QCDPME Daily [X X X Daily XX Daily XX XXX Daily XX Daily |X| XXX Continuous X Monthly |XX Monthly | xx As Required As Required XXX As Required X XXX Figure 6.1-2: Key Processes, and Measures or Indicators to Control and Improve Them Method for Determining Key Requirements that Measures or Indicators to Control Key Work Process Requirements Work Process Must Meet and improve Work Processes Key Work Process Shipping Cycle counts, scanning system Accurate quantity Shipping = delivery time Receiving/Inventory Daily cycle counting Right parts in the right place, accurate quantity Kanban readiness Integrity inventory at min/max targets, correct part number Production Scheduling Production Manager plans monthly Meet customer schedule, daily labor requirements Capacity metric - completion rate schedule by area, accurate production schedule Product Quality Overall quality operating system: ISO Quality of part, meet customer expectations of Daily audits on defects, dealer hotline audits throughout the year product Fabrication/Paint Production Manager plans monthly Meet customer schedule, quality, cost delivery Downtime, rejects, scrap, parts produced schedule with daily review, quality processes above Assembly Production Manager plans monthly Meet customer schedule, quality cost delivery Completion rate, units produced schedule with daily review, quality processes above Key Support Process Maintenance Review of the value stream Reliable process to produce product Meet customer demand, scheduled, predictive, breakdown maintenance Supplier Quality Defect occurrence audits Quality, cost, delivery Rejects Quality Improvements Control nonconforming product, Quality, cost delivery Efficiency = assembly, fabrication corrective action, Kaizen, VSM, LSS Effectiveness assembly, fabrication Reduction of cycle time = constraints in assembly, fabrication HR/Training Recertification, onboarding Training completion audits % Cross trained novice proficient, accomplished, master IT Manage implementation of new and Work order completion Equipment downtime, response time existing equipment, new models Safety Job hazard audits Ensuring a safe environment OSHA reportable, lost work days Finance Strategic planning Balanced budget Department expenses planned vs. actual


