

Question: question: The attached plots were constructed using a sample of 272 observations. Each observation gives the elapsed time (in minutes) of an eruption of Old
question:
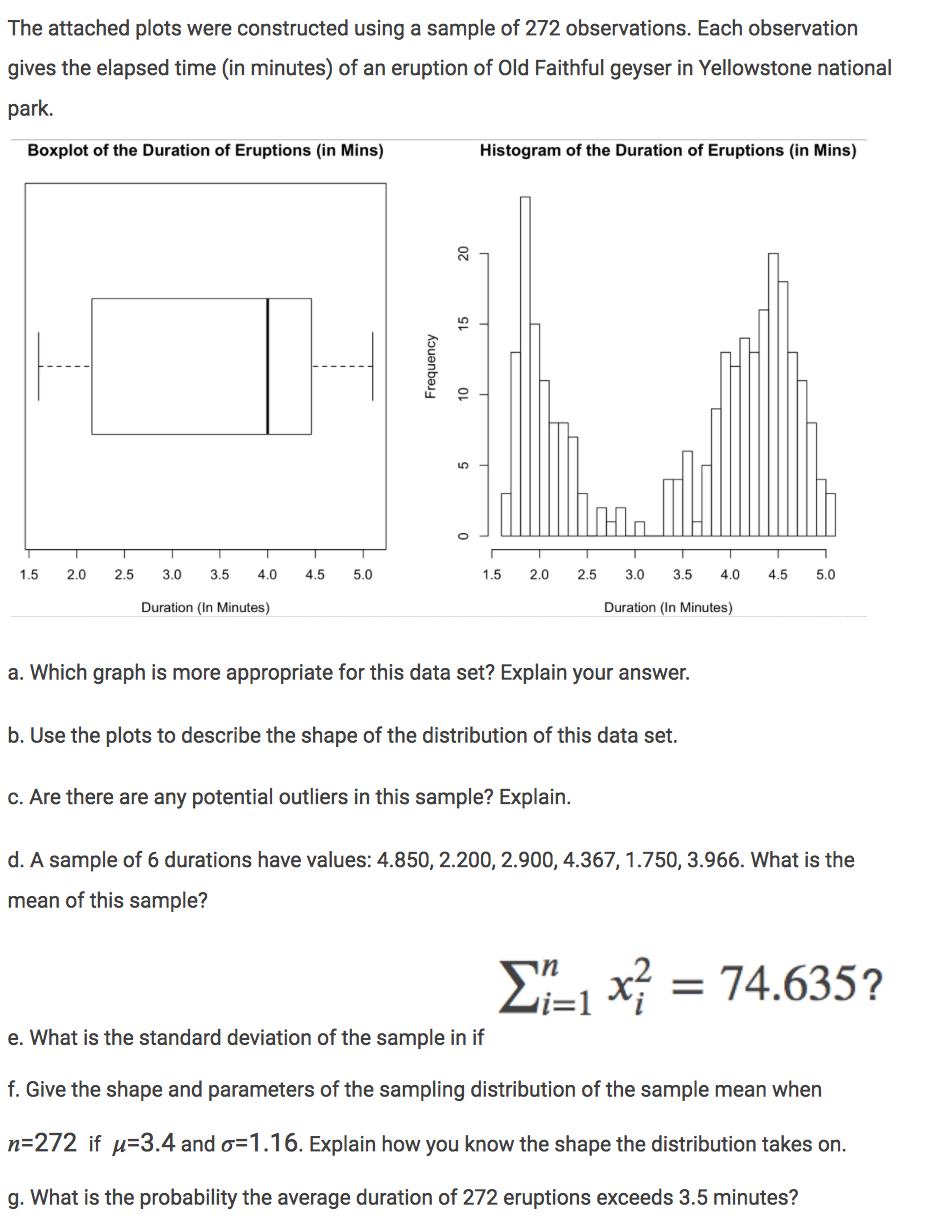
The attached plots were constructed using a sample of 272 observations. Each observation gives the elapsed time (in minutes) of an eruption of Old Faithful geyser in Yellowstone national park. Boxplot of the Duration of Eruptions [in Mins] Histogram of the Duration of Eruptions [in Mins] 20 15 Frequency 10 I T I I I T I I 1.5 2.0 2.5 3.0 3.5 4.0 4.5 5.0 1.5 2 .0 2.5 3.0 3.5 4.0 4.5 5.0 Duration (In Minutes] Duration {In Minutes) a. Which graph is more appropriate for this data set? Explain your answer. b. Use the plots to describe the shape of the distribution of this data set. 0. Are there are any potential outliers in this sample? Explain. d. A sample of 6 durations have values: 4.850. 2.200, 2.900, 4.367, 1.750. 3.966. What is the mean of this sample? n 2 e. What is the standard deviation of the sample in if f. Give the shape and parameters of the sampling distribution of the sample mean when n=272 if ,u=3.4 and o=1.16. Explain how you know the shape the distribution takes on. Q. What is the probability the average duration of 272 eruptions exceeds 3.5 minutes
Step by Step Solution
There are 3 Steps involved in it

Get step-by-step solutions from verified subject matter experts