

Question: Question: The table below shows the CO2 emission values released into the atmosphere at different speeds of a vehicle. The first column gives the
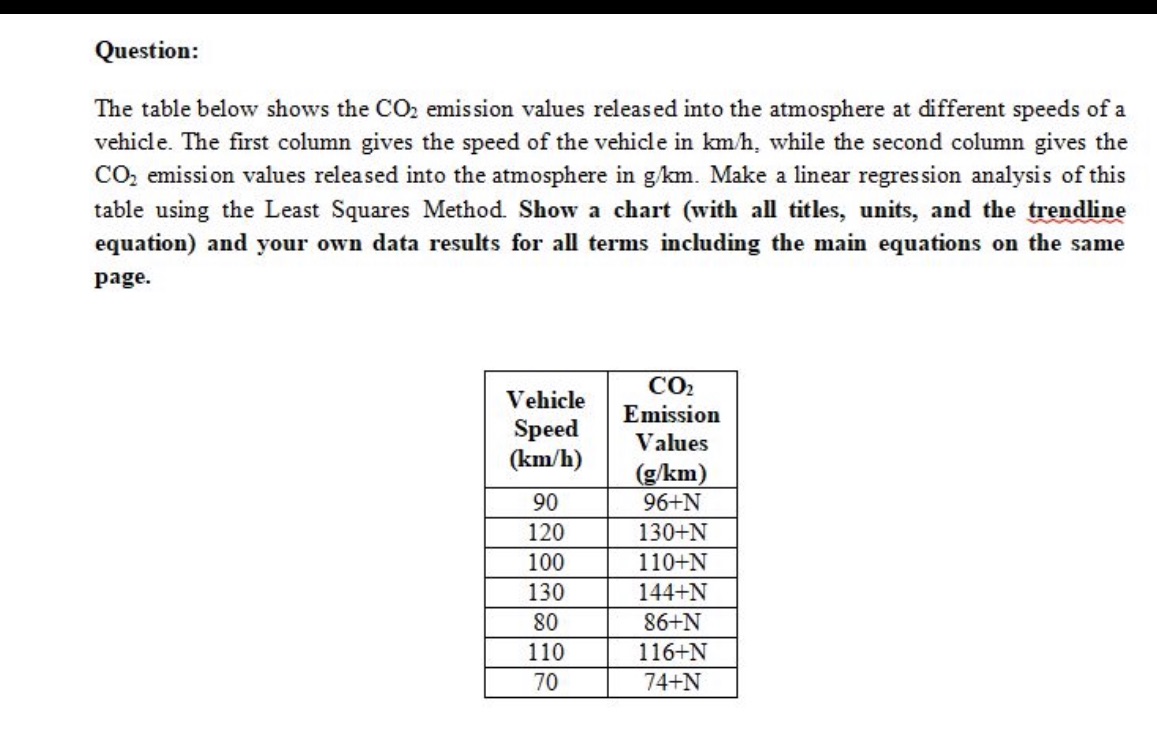
Question: The table below shows the CO2 emission values released into the atmosphere at different speeds of a vehicle. The first column gives the speed of the vehicle in km/h, while the second column gives the CO2 emission values released into the atmosphere in g/km. Make a linear regression analysis of this table using the Least Squares Method. Show a chart (with all titles, units, and the trendline equation) and your own data results for all terms including the main equations on the same page. CO Vehicle Emission Speed Values (km/h) (g/km) 90 96+N 120 130+N 100 110+N 130 144+N 80 86+N 110 116+N 70 74+N
Step by Step Solution
There are 3 Steps involved in it

Get step-by-step solutions from verified subject matter experts