

Question: Question The table below shows the total expenditure on a basket of goods and services in four consecutive years. Use this information to calculate the
Question
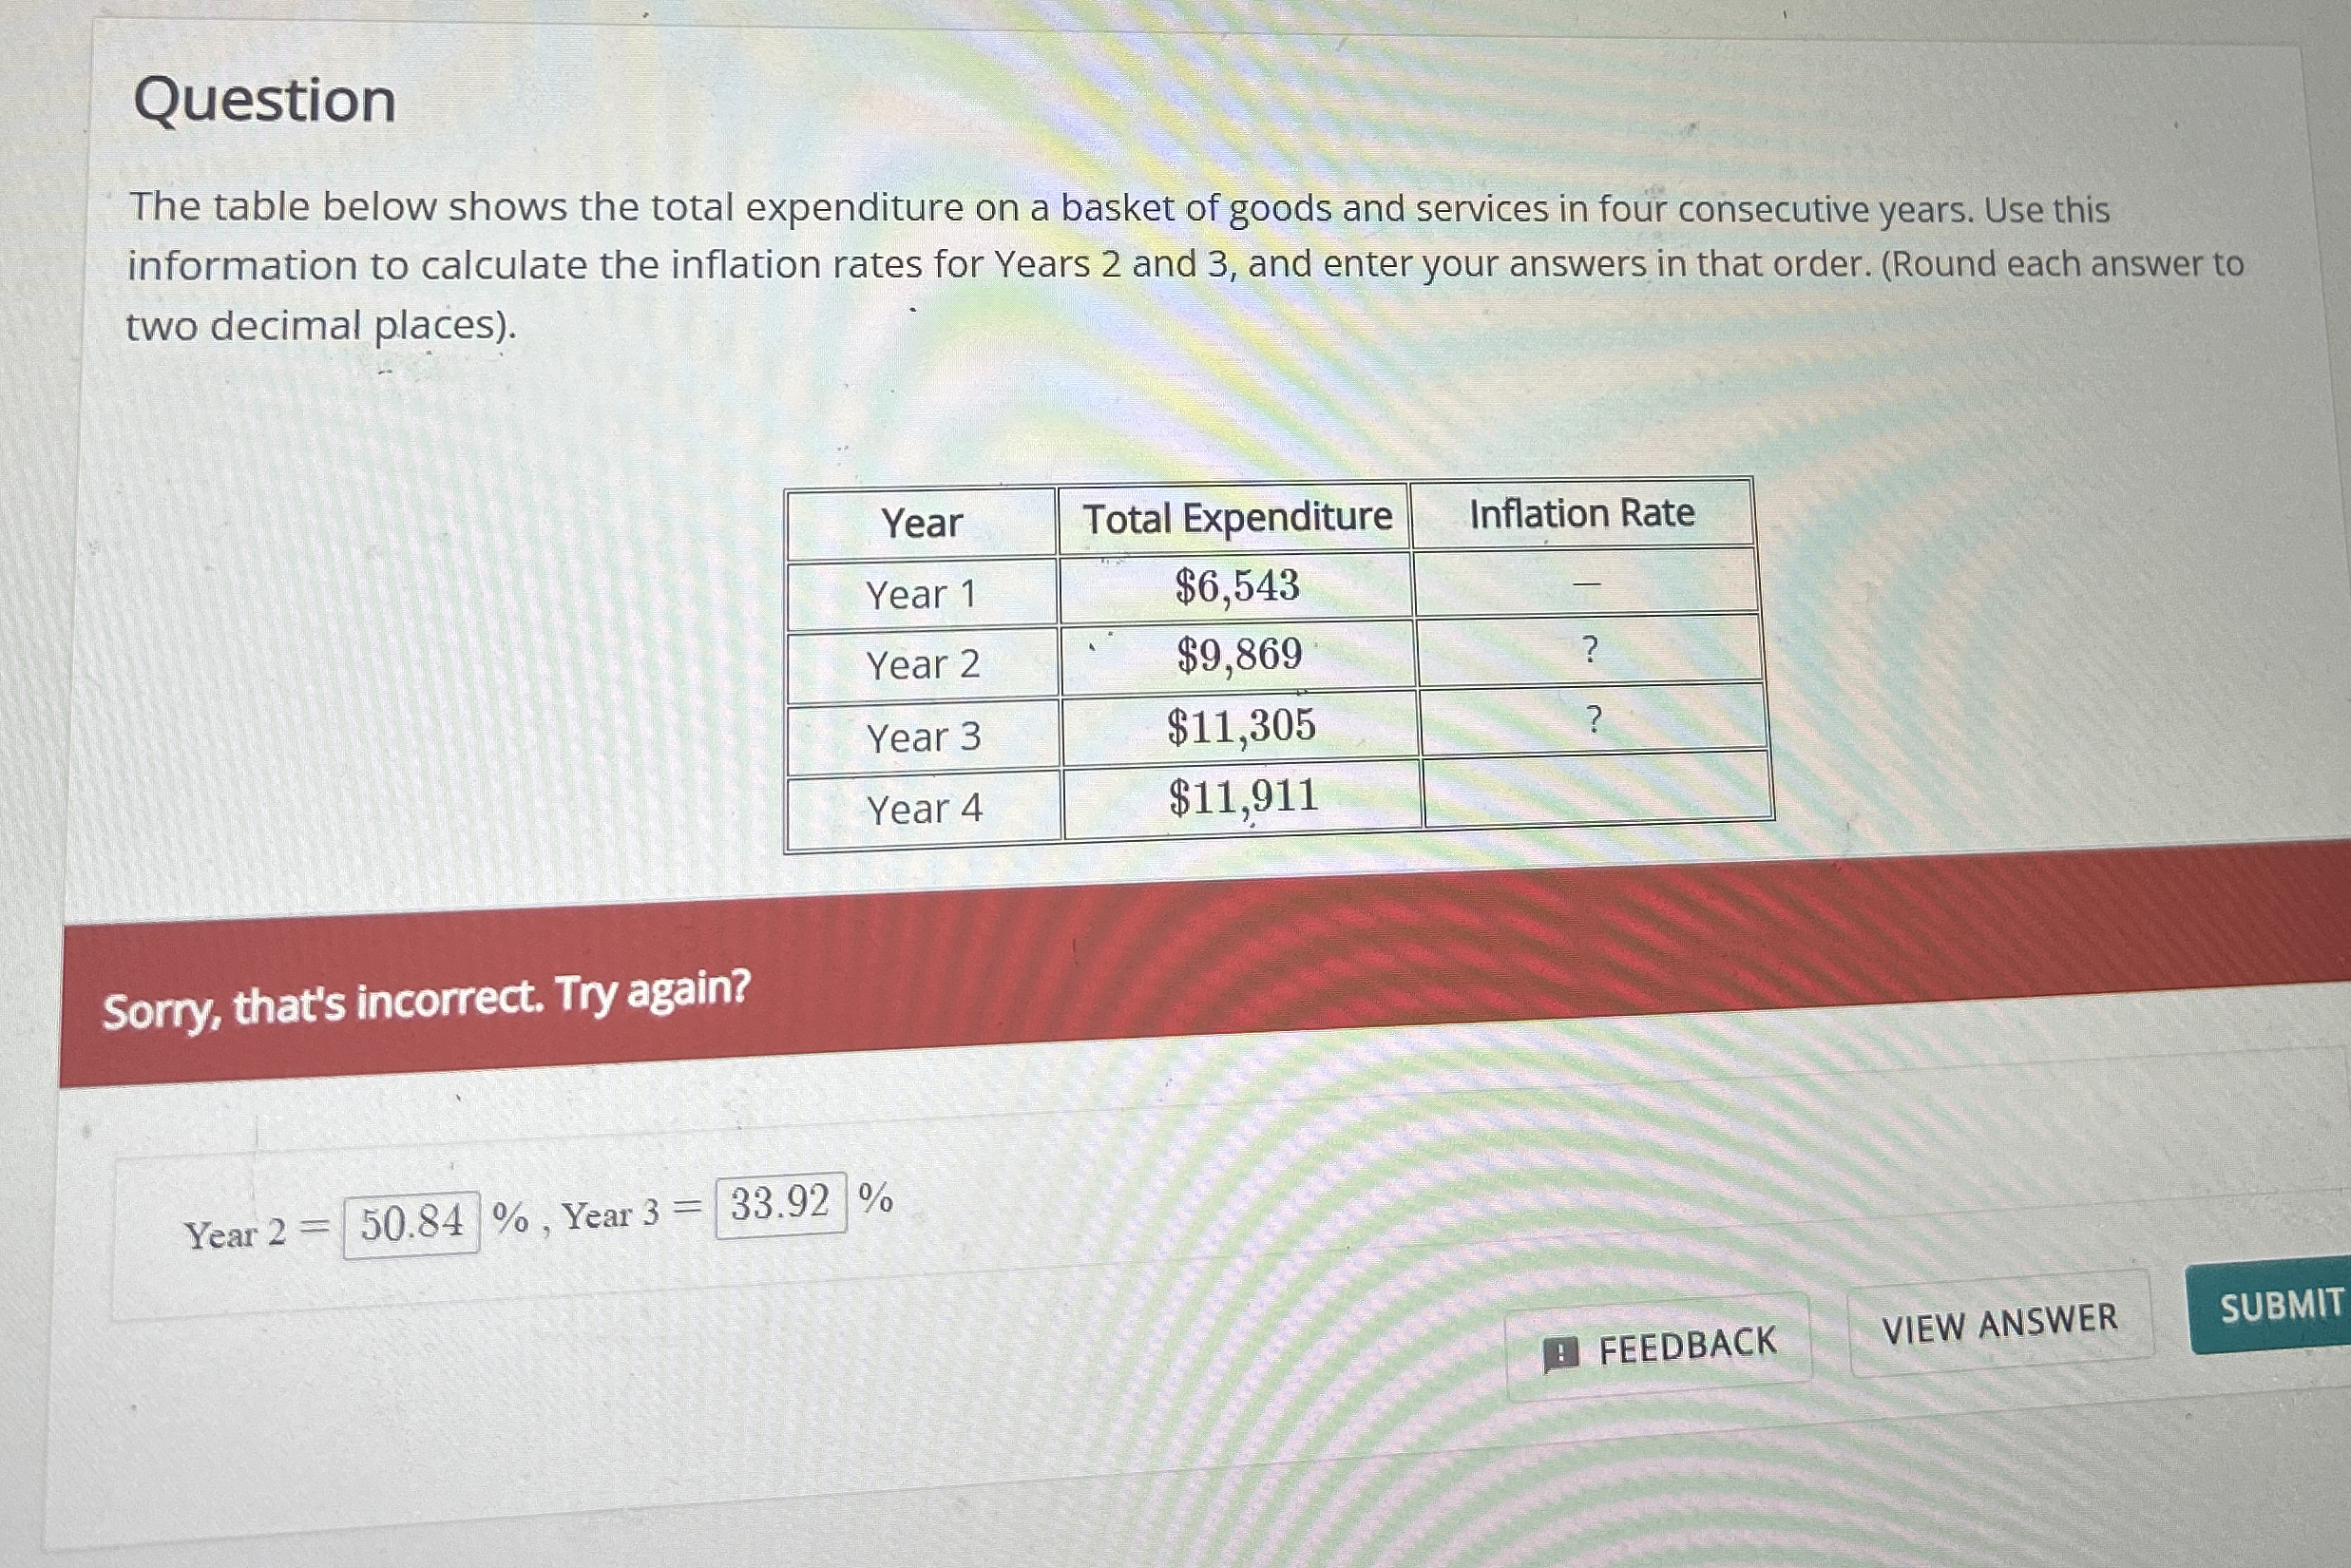
The table below shows the total expenditure on a basket of goods and services in four consecutive years. Use this information to calculate the inflation rates for Years and and enter your answers in that order. Round each answer to two decimal places
tableYearTotal Expenditure,Inflation RateYear $Year $
Step by Step Solution
There are 3 Steps involved in it
1 Expert Approved Answer
Step: 1 Unlock

Question Has Been Solved by an Expert!
Get step-by-step solutions from verified subject matter experts
Step: 2 Unlock
Step: 3 Unlock