

Question: Question This data comes from a survey for the Spring 2010 term. The boxplots represent the number of states visited among students who are internationals
Question
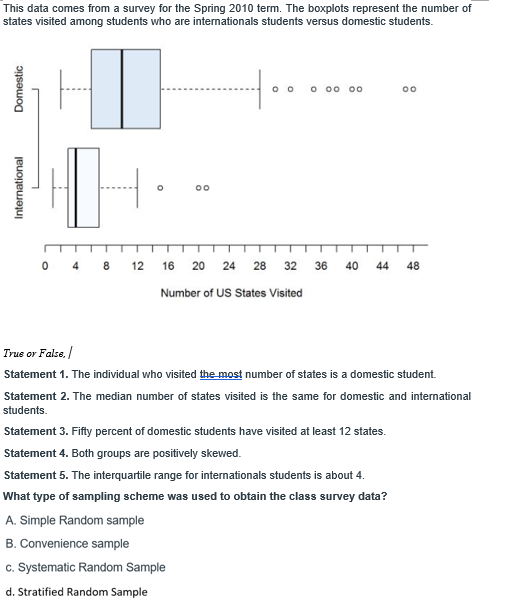
This data comes from a survey for the Spring 2010 term. The boxplots represent the number of states visited among students who are internationals students versus domestic students. Domestic oo 0 00 00 International 4 8 12 16 20 24 28 32 36 40 44 48 Number of US States Visited True or False. / Statement 1. The individual who visited the most number of states is a domestic student. Statement 2. The median number of states visited is the same for domestic and international students. Statement 3. Fifty percent of domestic students have visited at least 12 states. Statement 4. Both groups are positively skewed. Statement 5. The interquartile range for internationals students is about 4. What type of sampling scheme was used to obtain the class survey data? A. Simple Random sample B. Convenience sample c. Systematic Random Sample d. Stratified Random Sample
Step by Step Solution
There are 3 Steps involved in it

Get step-by-step solutions from verified subject matter experts