

Question: Question Timeout Estimation Assume: Initial Estimated Mean RTT = 20 ms IntitalEstimated Deviation in RTT = 4 ms Samples taken (27 values all in ms)
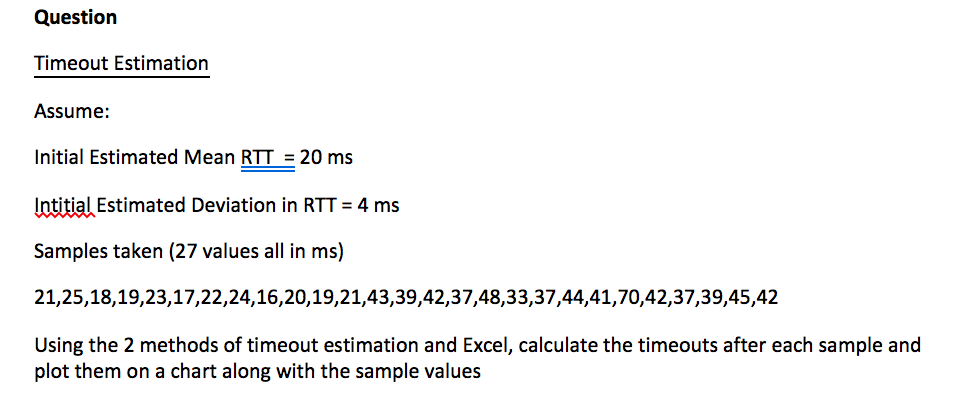
Question Timeout Estimation Assume: Initial Estimated Mean RTT = 20 ms IntitalEstimated Deviation in RTT = 4 ms Samples taken (27 values all in ms) 21,25,18,19,23,17,22,24,16,20,19,21,43,39,42,37,48,33,37,44,41,70,42,37,39,45,42 Using the 2 methods of timeout estimation and Excel, calculate the timeouts after each sample and plot them on a chart along with the sample values
Step by Step Solution
There are 3 Steps involved in it
1 Expert Approved Answer
Step: 1 Unlock

Question Has Been Solved by an Expert!
Get step-by-step solutions from verified subject matter experts
Step: 2 Unlock
Step: 3 Unlock