

Question: QUESTION Two [25] 2.1 Evaluate the following statement, choosing the ONE correct diagram, between Diagram A and Diagram B to motivate your answer: When a
![QUESTION Two [25] 2.1 Evaluate the following statement, choosing the ONE](https://s3.amazonaws.com/si.experts.images/answers/2024/06/667c8afcf30ab_076667c8afcc8fae.jpg)
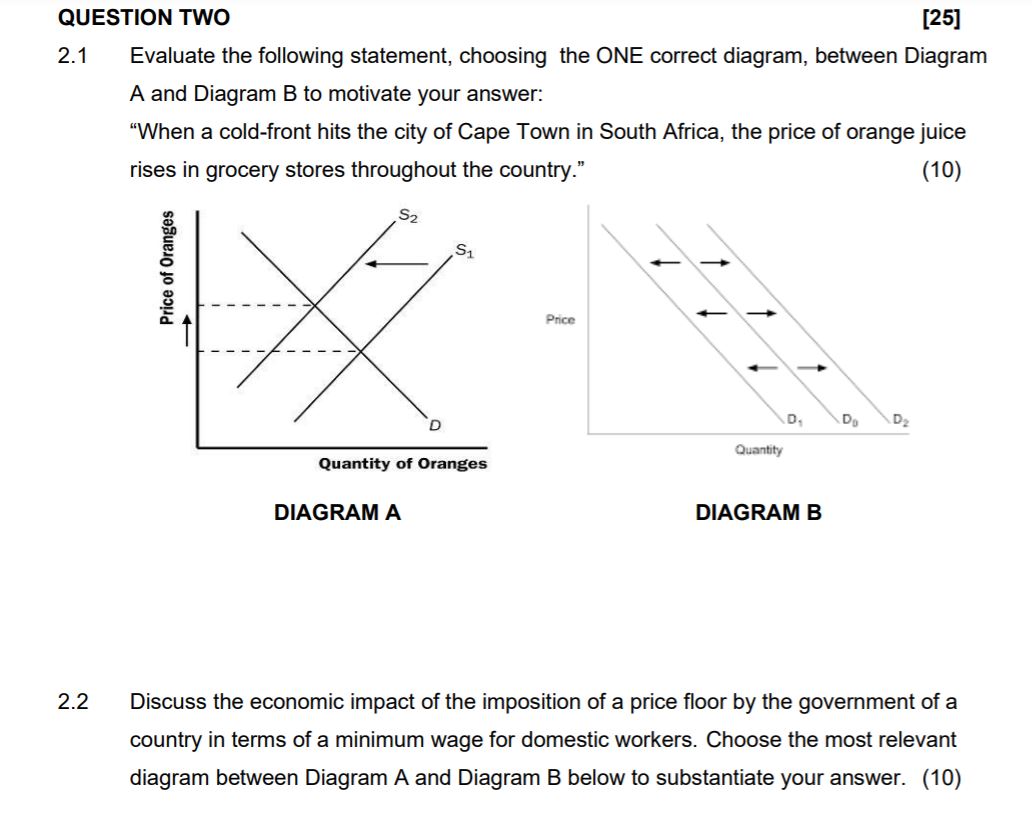
QUESTION Two [25] 2.1 Evaluate the following statement, choosing the ONE correct diagram, between Diagram A and Diagram B to motivate your answer: "When a cold-front hits the city of Cape Town in South Africa, the price of orange juice rises in grocery stores throughout the country.\" (10) DIAGRAM A DIAGRAM B 2.2 Discuss the economic impact of the imposition of a price oor by the govemment of a country in terms of a minimum wage for domestic workers. Choose the most relevant diagram between Diagram A and Diagram B below to substantiate your
Step by Step Solution
There are 3 Steps involved in it
1 Expert Approved Answer
Step: 1 Unlock

Question Has Been Solved by an Expert!
Get step-by-step solutions from verified subject matter experts
Step: 2 Unlock
Step: 3 Unlock