

Question: Question Two The table below compare the master budget to flexible budget and flexible budget to actual results of selected five cost types: MASTER BUDGET
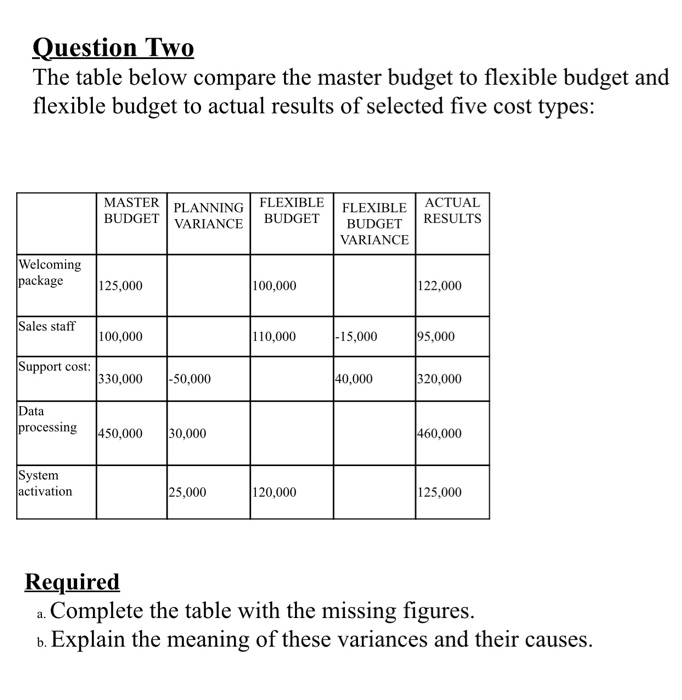
Question Two The table below compare the master budget to flexible budget and flexible budget to actual results of selected five cost types: MASTER BUDGET PLANNING FLEXIBLE BUDGET FLEXIBLE ACTUAL BUDGET RESULTS VARIANCE Welcoming package 125,000 100,000 122,000 Sales staff 100,000 110,000 -15,000 95,000 Support cost: * 330,000 -50,000 40,000 320,000 Data processing 450,000 30,000 460,000 System activation 25,000 120,000 125,000 Required a. Complete the table with the missing figures. b. Explain the meaning of these variances and their causes
Step by Step Solution
There are 3 Steps involved in it
1 Expert Approved Answer
Step: 1 Unlock

Question Has Been Solved by an Expert!
Get step-by-step solutions from verified subject matter experts
Step: 2 Unlock
Step: 3 Unlock