

Question: Question type: Monte Carlo Simulation Phantom Controls monitors and repairs control circuit boxes on elevators installed in multistory buildings in downtown Chicago. The company has
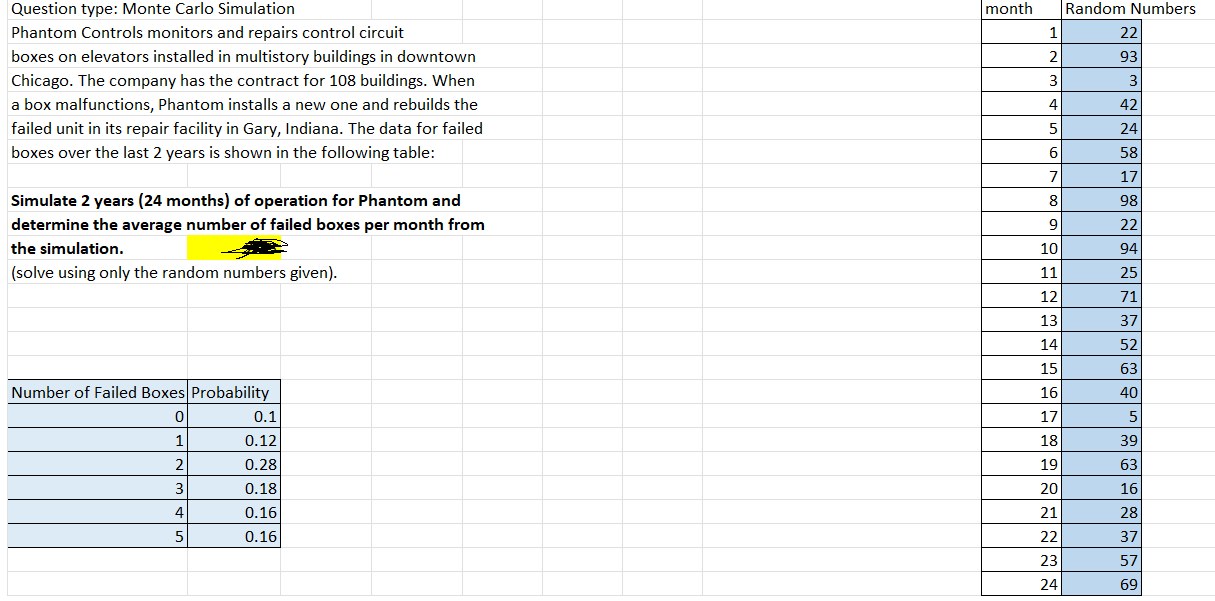
Question type: Monte Carlo Simulation Phantom Controls monitors and repairs control circuit boxes on elevators installed in multistory buildings in downtown Chicago. The company has the contract for 108 buildings. When a box malfunctions, Phantom installs a new one and rebuilds the failed unit in its repair facility in Gary, Indiana. The data for failed boxes over the last 2 years is shown in the following table: Simulate 2 years ( 24 months) of operation for Phantom and determine the average number of failed boxes per month from the simulation. (solve using only the random numbers given). \begin{tabular}{|r|r|} \hline Number of Failed Boxes & Probability \\ \hline 0 & 0.1 \\ \hline 1 & 0.12 \\ \hline 2 & 0.28 \\ \hline 3 & 0.18 \\ \hline 4 & 0.16 \\ \hline 5 & 0.16 \\ \hline \end{tabular} \begin{tabular}{|r|r|} \hline month & Random Nu \\ \hline 1 & 22 \\ \hline 2 & 93 \\ \hline 3 & 3 \\ \hline 4 & 42 \\ \hline 5 & 24 \\ \hline 6 & 58 \\ \hline 7 & 17 \\ \hline 8 & 98 \\ \hline 9 & 22 \\ \hline 10 & 94 \\ \hline 11 & 25 \\ \hline 12 & 71 \\ \hline 13 & 37 \\ \hline 14 & 52 \\ \hline 15 & 63 \\ \hline 16 & 40 \\ \hline 17 & 5 \\ \hline 18 & 39 \\ \hline 19 & 63 \\ \hline 20 & 16 \\ \hline 21 & 28 \\ \hline 22 & 37 \\ \hline 23 & 57 \\ \hline 24 & 69 \\ \hline \end{tabular} Question type: Monte Carlo Simulation Phantom Controls monitors and repairs control circuit boxes on elevators installed in multistory buildings in downtown Chicago. The company has the contract for 108 buildings. When a box malfunctions, Phantom installs a new one and rebuilds the failed unit in its repair facility in Gary, Indiana. The data for failed boxes over the last 2 years is shown in the following table: Simulate 2 years ( 24 months) of operation for Phantom and determine the average number of failed boxes per month from the simulation. (solve using only the random numbers given). \begin{tabular}{|r|r|} \hline Number of Failed Boxes & Probability \\ \hline 0 & 0.1 \\ \hline 1 & 0.12 \\ \hline 2 & 0.28 \\ \hline 3 & 0.18 \\ \hline 4 & 0.16 \\ \hline 5 & 0.16 \\ \hline \end{tabular} \begin{tabular}{|r|r|} \hline month & Random Nu \\ \hline 1 & 22 \\ \hline 2 & 93 \\ \hline 3 & 3 \\ \hline 4 & 42 \\ \hline 5 & 24 \\ \hline 6 & 58 \\ \hline 7 & 17 \\ \hline 8 & 98 \\ \hline 9 & 22 \\ \hline 10 & 94 \\ \hline 11 & 25 \\ \hline 12 & 71 \\ \hline 13 & 37 \\ \hline 14 & 52 \\ \hline 15 & 63 \\ \hline 16 & 40 \\ \hline 17 & 5 \\ \hline 18 & 39 \\ \hline 19 & 63 \\ \hline 20 & 16 \\ \hline 21 & 28 \\ \hline 22 & 37 \\ \hline 23 & 57 \\ \hline 24 & 69 \\ \hline \end{tabular}
Step by Step Solution
There are 3 Steps involved in it

Get step-by-step solutions from verified subject matter experts