

Question: Question (use as many points as needed from my account) Produce appropriate descriptive statistics and graphics examples of these are measures of central tendency and
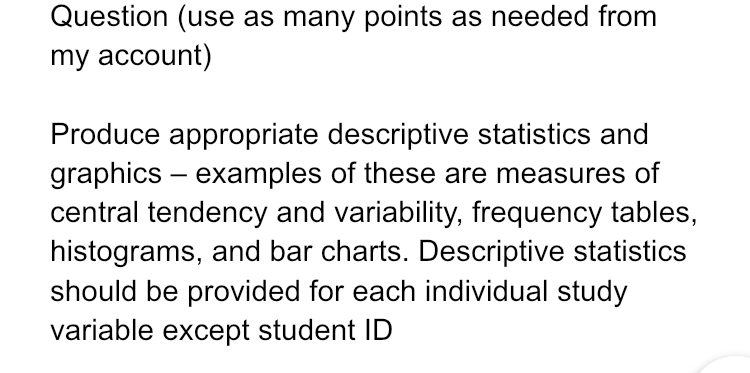
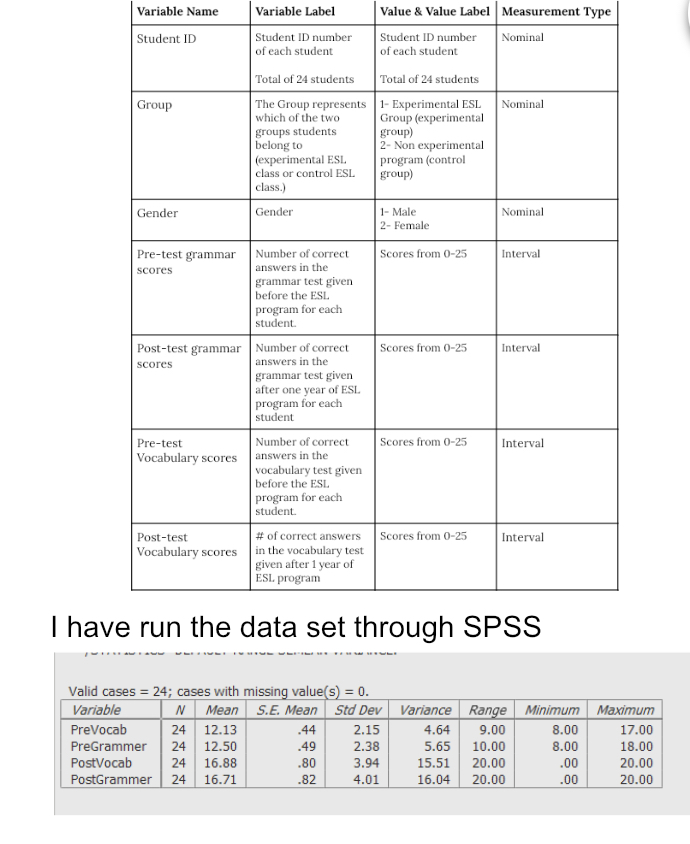
Question (use as many points as needed from my account) Produce appropriate descriptive statistics and graphics examples of these are measures of central tendency and variability, frequency tables, histograms, and bar charts. Descriptive statistics should be provided for each individual study variable except student ID Variable Name Variable Label Value & Value Label Measurement Type Student ID Student ID number Student ID number Nominal of each student of each student Total of 24 students Total of 24 students Group The Group represents 1- Experimental ESL Nominal which of the two Group (experimental groups students group) belong to 2- Non experimental (experimental ESL program (control class or control ESL group) class.) Gender Gender 1- Male Nominal 2- Female Pre-test grammar Number of correct Scores from 0-25 Interval scores answers in the grammar test given before the ESL program for each student Post-test grammar Number of correct Scores from 0-25 Interval scores answers in the grammar test given after one year of ESL program for each student Pre-test Number of correct Scores from 0-25 Interval Vocabulary scores answers in the vocabulary test given before the ESL program for each student. Post-test # of correct answers Scores from 0-25 Interval Vocabulary scores in the vocabulary test given after 1 year of ESL program I have run the data set through SPSS Valid cases = 24; cases with missing value(s) = 0. Variable N Mean S.E. Mean Std Dev Variance Range Minimum Maximum PreVocab 24 12.13 44 2.15 4.64 9.00 8.00 17.00 PreGrammer 24 12.50 .49 2.38 5.65 10.00 8.00 18.00 PostVocab 24 16.88 .80 3.94 15.51 20.00 00 20.00 PostGrammer 24 16.71 .82 4.01 16.04 20.00 00 20.00
Step by Step Solution
There are 3 Steps involved in it

Get step-by-step solutions from verified subject matter experts