

Question: Question: Use the data from the table containing weekly payrolls for two imaginary restaurants to create parallel box plots using Excel or StatCrunch.Then give statistical
Question: Use the data from the table containing weekly payrolls for two imaginary restaurants to create parallel box plots using Excel or StatCrunch.Then givestatistical reasoning to tell which restaurant you would rather work for.
So this is what i did did i do it correct? if yes, please explain to me why statistically which restaurant you would rather work for?
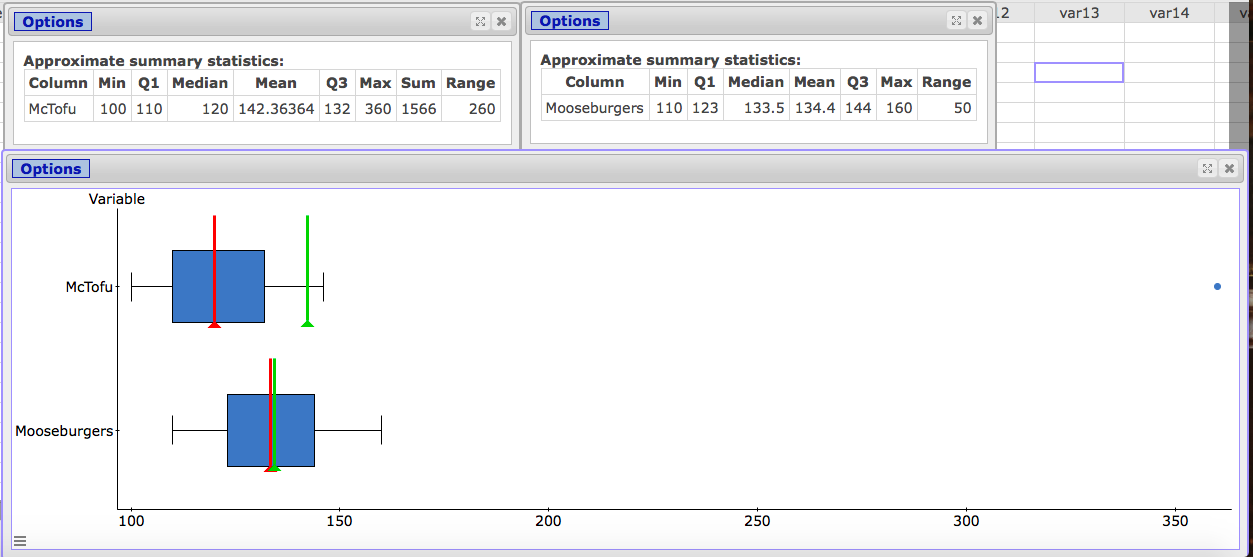
Agpruximata summary stalistics: Agpruximata summary Column Min Q1 Median Mean Q3 Column Q1 McTnfu 100 110 120 14236364 Mooseburgers 123 Variable Monsebu rgers
Step by Step Solution
There are 3 Steps involved in it
1 Expert Approved Answer
Step: 1 Unlock

Question Has Been Solved by an Expert!
Get step-by-step solutions from verified subject matter experts
Step: 2 Unlock
Step: 3 Unlock