

Question: Question : Use the t table to bracket the p-value. That is, using the t table, find a lower and upper bound for the p-value.
Question : Use the t table to bracket the p-value. That is, using the t table, find a lower and upper bound for the p-value.
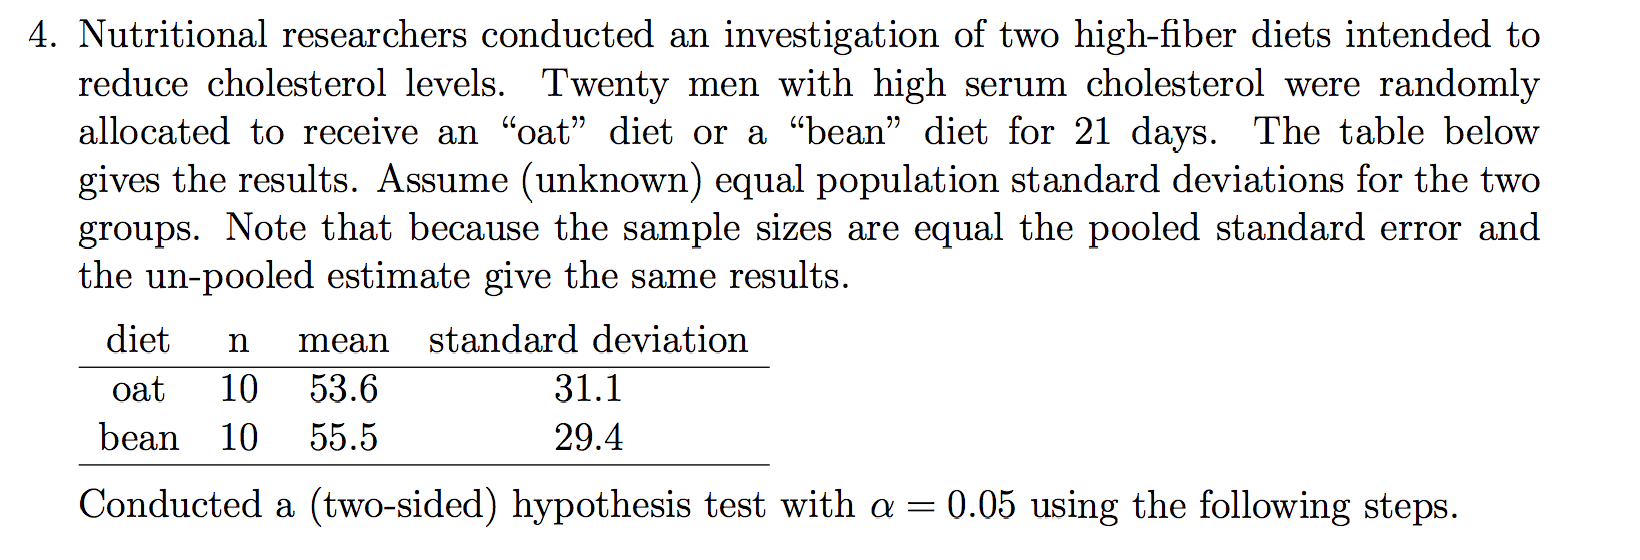
4. Nutritional researchers conducted an investigation of two highber diets intended to reduce cholesterol levels. Twenty men with high serum cholesterol were randomly allocated to receive an \"oat\" diet or a \"bean\" diet for 21 days. The table below gives the results. Assume (unknown) equal population standard deviations for the two groups. Note that because the sample sizes are equal the pooled standard error and the unpooled estimate give the same results. diet n mean stande deviation oat 10 53.6 31.1 bean 10 55.5 29.4 Conducted a (twosided) hypothesis test with a = 0.05 using the following steps
Step by Step Solution
There are 3 Steps involved in it

Get step-by-step solutions from verified subject matter experts