

Question: Question: Use this excel file as it has the numbers in it: https://secure.parsa.com/index.php/s/5PdZyPAf2eeHNxq A data set called food_test.xlsx contains four food categories as well as
Question:
Use this excel file as it has the numbers in it:
https://secure.parsa.com/index.php/s/5PdZyPAf2eeHNxq
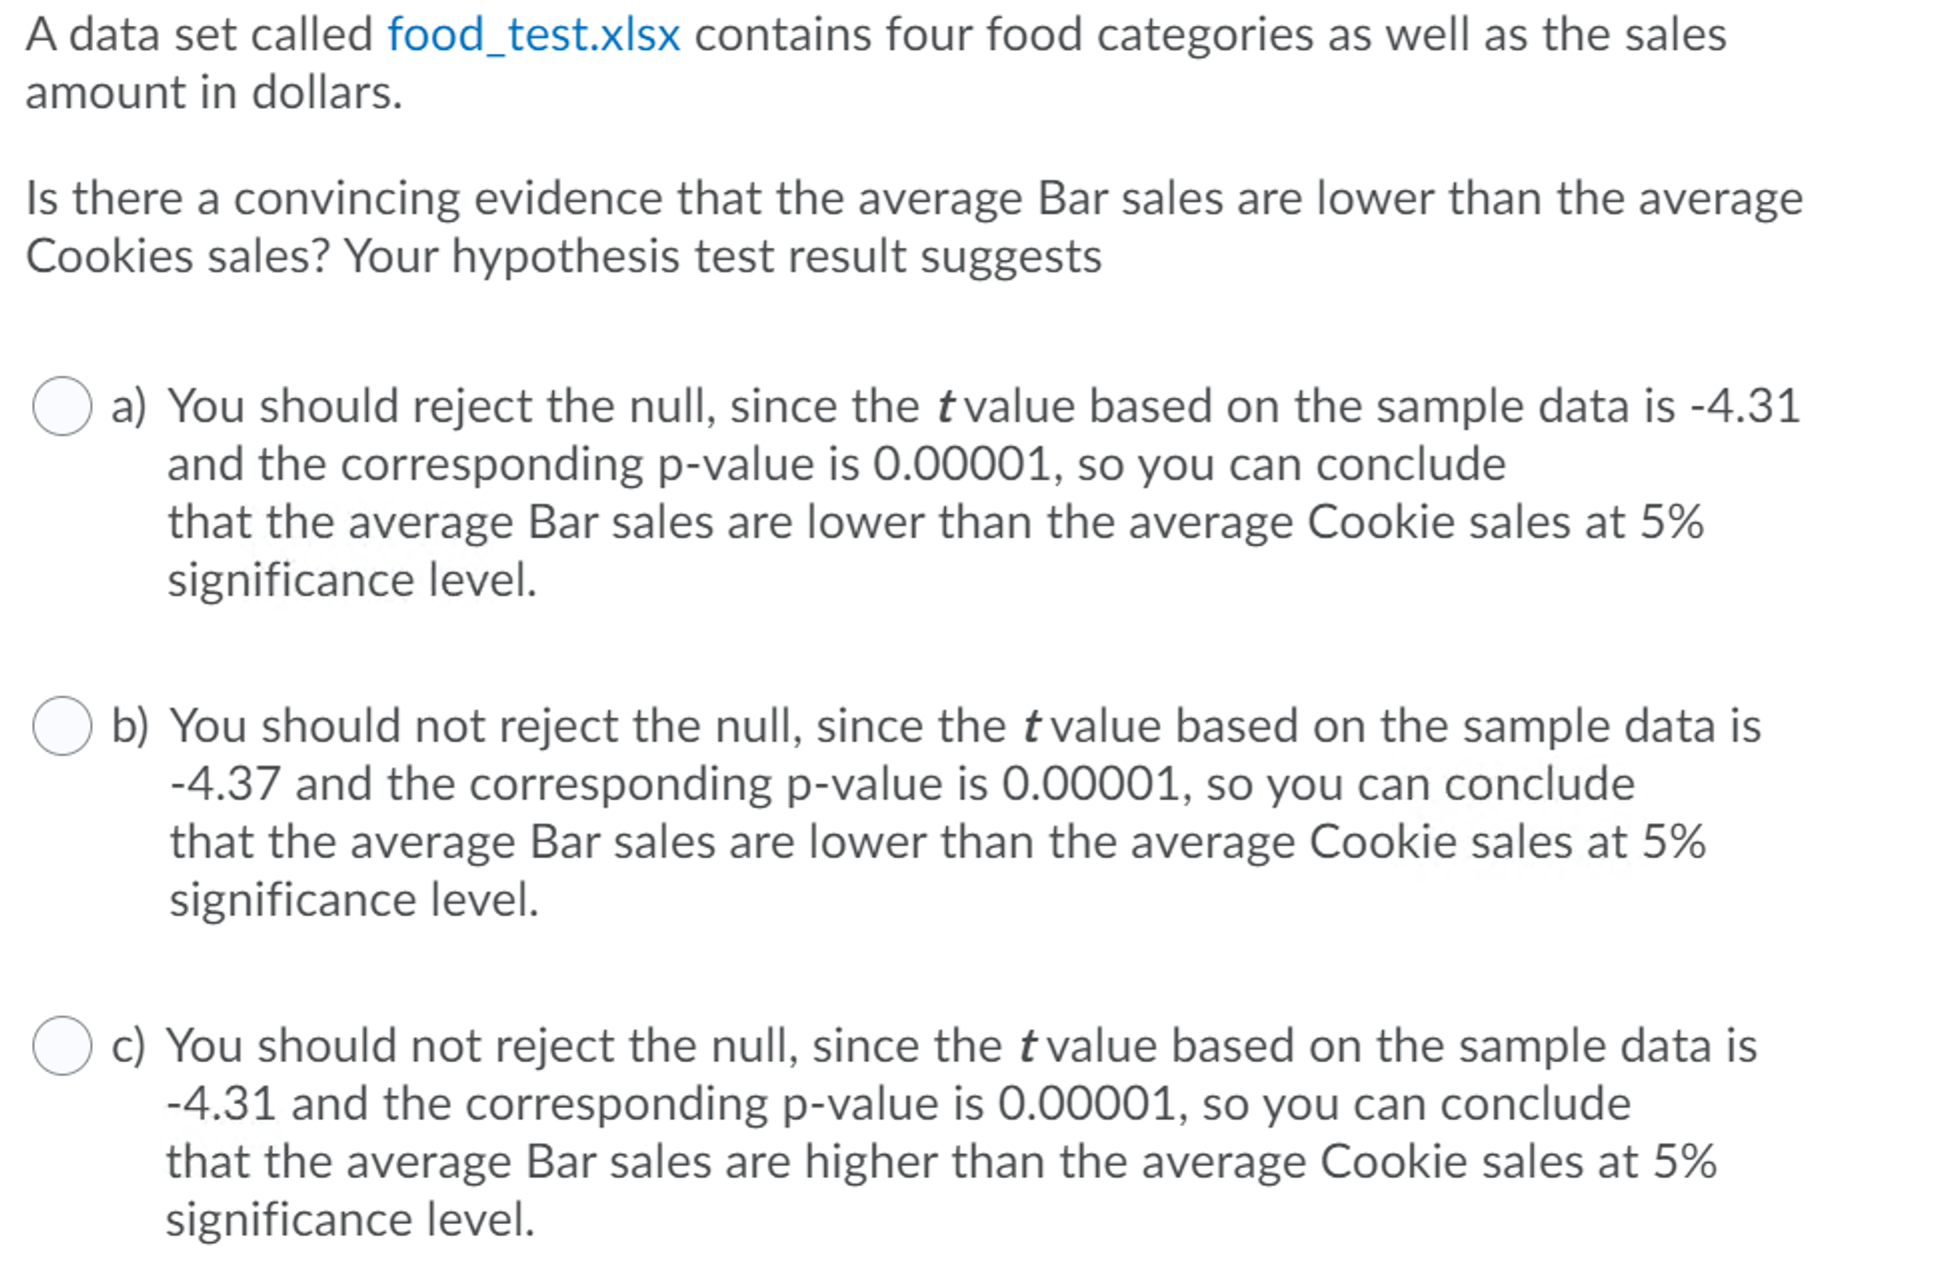
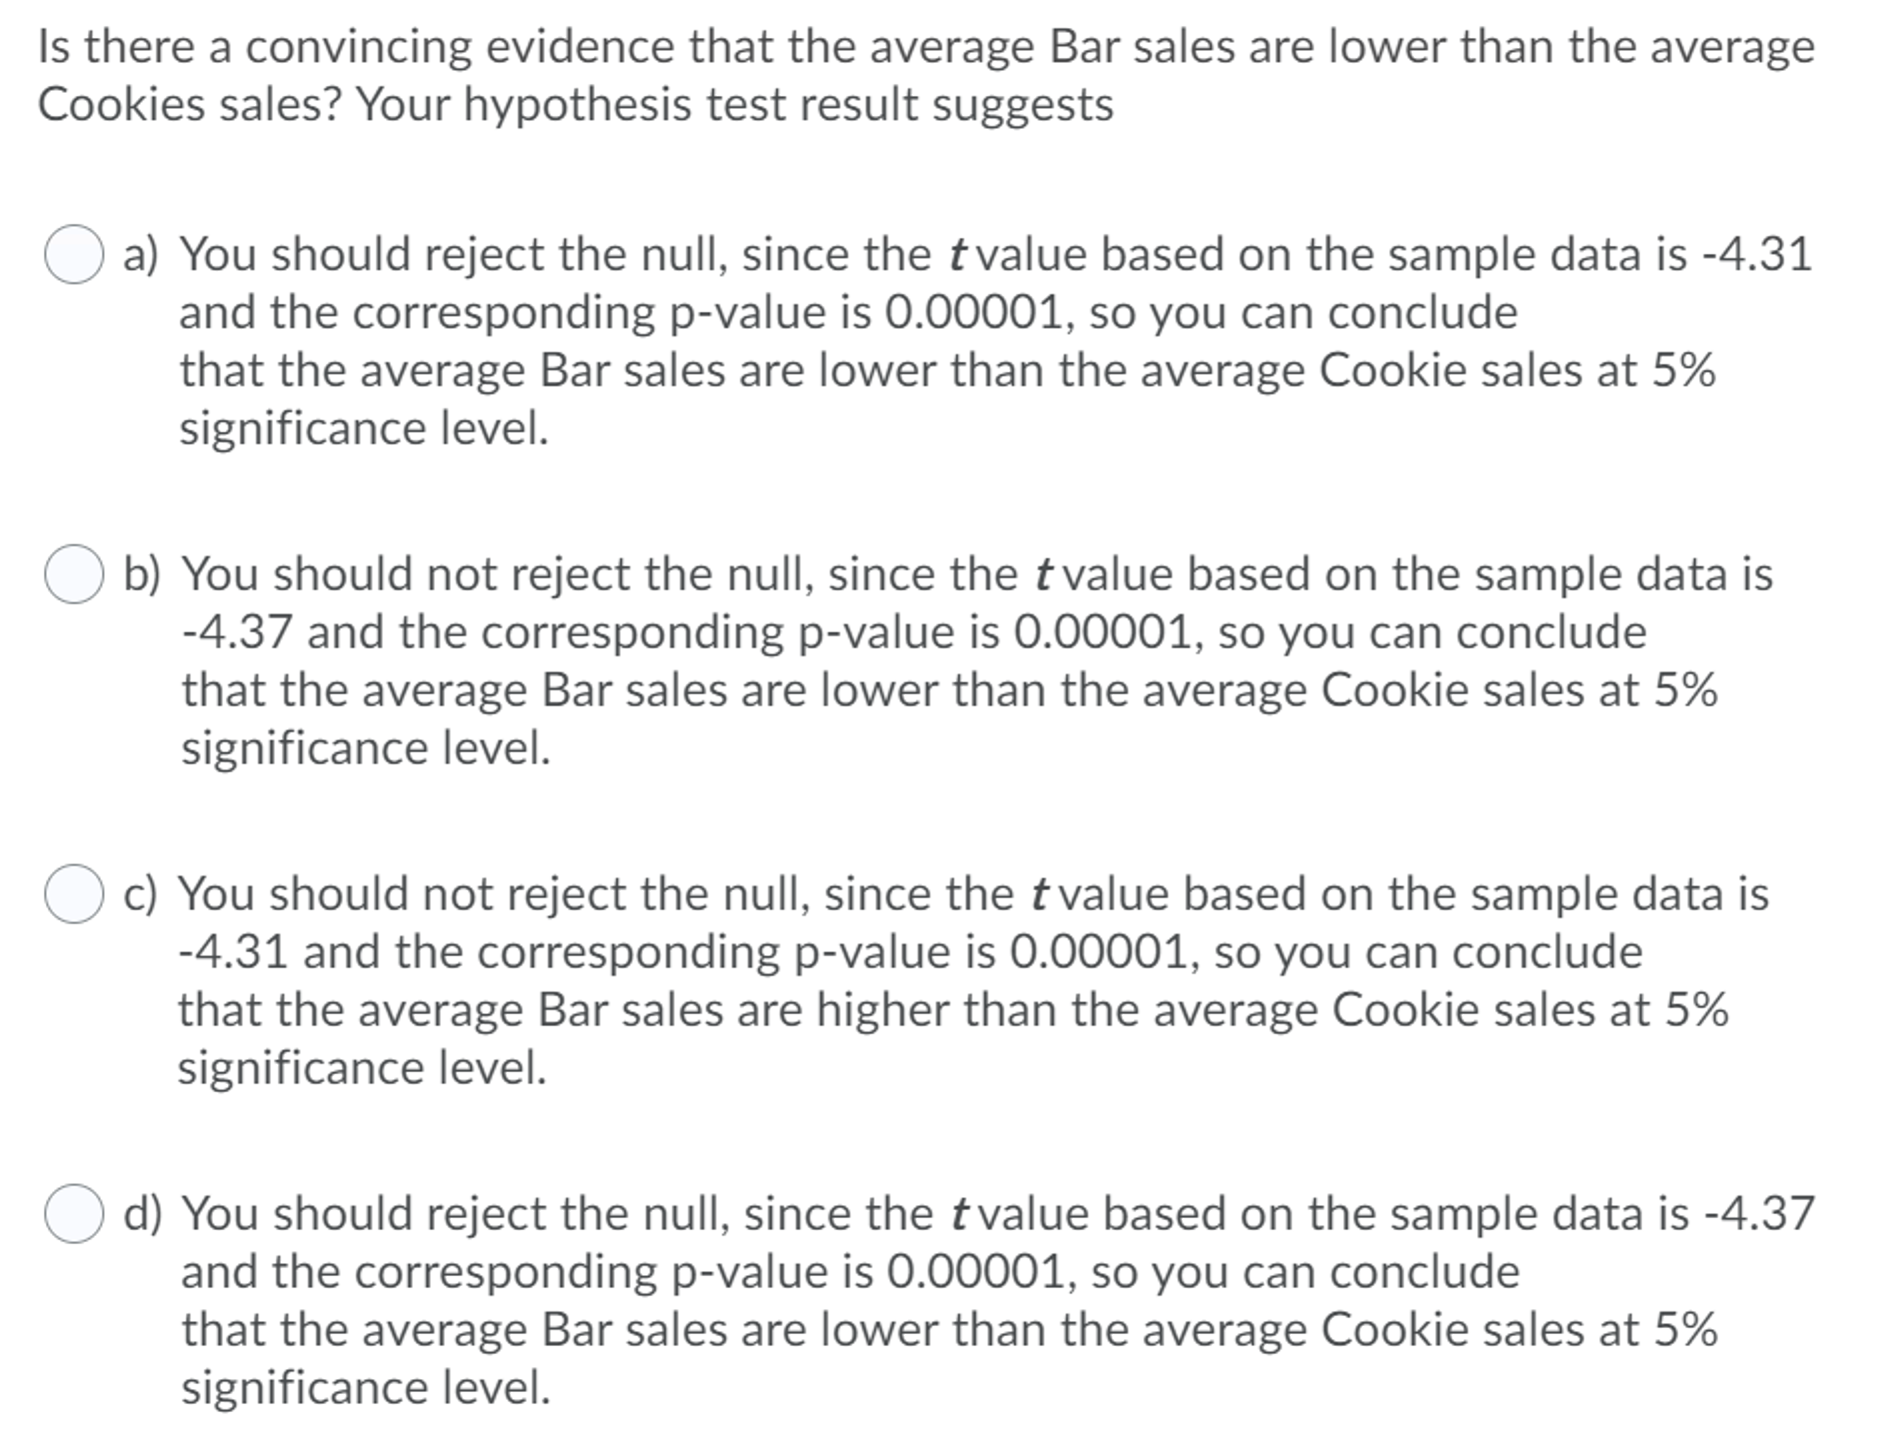
A data set called food_test.xlsx contains four food categories as well as the sales amount in dollars. Is there a convincing evidence that the average Bar sales are lower than the average Cookies sales? Your hypothesis test result suggests O a) You should reject the null, since the tvalue based on the sample data is -4.31 and the corresponding p-value is 0.00001, so you can conclude that the average Bar sales are lower than the average Cookie sales at 5% significance level. 0 b) You should not reject the null, since the tvalue based on the sample data is -4.37 and the corresponding p-value is 0.00001, so you can conclude that the average Bar sales are lower than the average Cookie sales at 5% significance level. 0 c) You should not reject the null, since the tvalue based on the sample data is -4.31 and the corresponding p-value is 0.00001, so you can conclude that the average Bar sales are higher than the average Cookie sales at 5% significance level. Is there a convincing evidence that the average Bar sales are lower than the average Cookies sales? Your hypothesis test result suggests O a) You should reject the null, since the tvalue based on the sample data is -4.31 and the corresponding p-value is 0.00001, so you can conclude that the average Bar sales are lower than the average Cookie sales at 5% significance level. 0 b) You should not reject the null, since the tvalue based on the sample data is -4.37 and the corresponding p-value is 0.00001, 50 you can conclude that the average Bar sales are lower than the average Cookie sales at 5% significance level. 0 c) You should not reject the null, since the tvalue based on the sample data is -4.31 and the corresponding p-value is 0.00001, so you can conclude that the average Bar sales are higher than the average Cookie sales at 5% significance level. Q d) You should reject the null, since the tvalue based on the sample data is -4.37 and the corresponding p-value is 0.00001, so you can conclude that the average Bar sales are lower than the average Cookie sales at 5% significance level
Step by Step Solution
There are 3 Steps involved in it

Get step-by-step solutions from verified subject matter experts