

Question: QUESTION: Using the data in Appendix A, construct a graph with units of production on the horizontal axis and materials cost and labour cost in
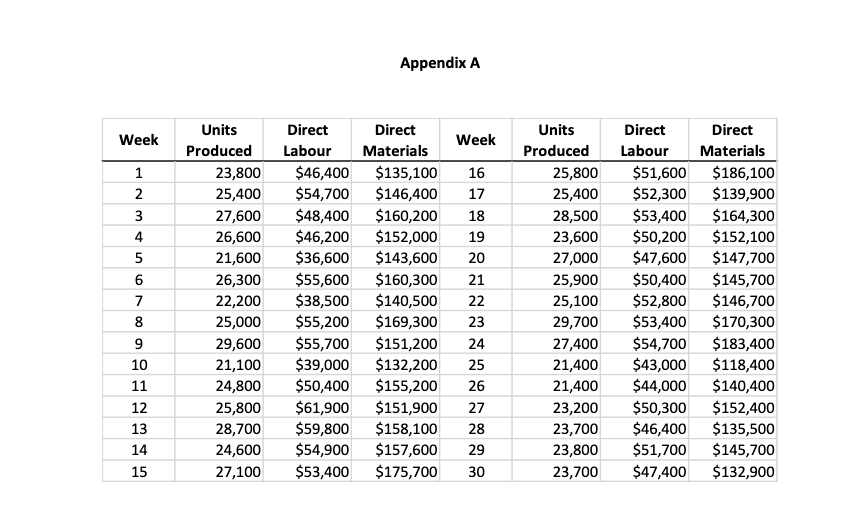
QUESTION: Using the data in Appendix A, construct a graph with units of production on the horizontal axis and materials cost and labour cost in the vertical axis. When formatting the graph line for materials cost and the graph line for labour cost, choose the option to add a linear trend line and select the option to display the equation for each trend line.
Appendix A Week Week 16 w N 5 1 2 3 4 5 6 7 8 9 10 11 12 13 14 15 Units Produced 23,800 25,400 27,600 26,600 21,600 26,300 22,200 25,000 29,600 21,100 24,800 25,800 28,700 24,600 27,100 Direct Labour $46,400 $54,700 $48,400 $46,200 $36,600 $55,600 $38,500 $55,200 $55,700 $39,000 $50,400 $61,900 $59,800 $54,900 $53,400 Direct Materials $135,100 $146,400 $160,200 $152,000 $143,600 $160,300 $140,500 $169,300 $151,200 $132,200 $155,200 $151,900 $158,100 $157,600 $175,700 17 18 19 20 21 22 23 24 25 26 27 28 29 30 Units Produced 25,800 25,400 28,500 23,600 27,000 25,900 25,100 29,700 27,400 21,400 21,400 23,200 23,700 23,800 23,700 Direct Labour $51,600 $52,300 $53,400 $50,200 $47,600 $50,400 $52,800 $53,400 $54,700 $43,000 $44,000 $50,300 $46,400 $51,700 $47,400 Direct Materials $186,100 $139,900 $164,300 $152,100 $147,700 $145,700 $146,700 $170,300 $183,400 $118,400 $140,400 $152,400 $135,500 $145,700 $132,900
Step by Step Solution
There are 3 Steps involved in it

Get step-by-step solutions from verified subject matter experts