

Question: QUESTION & Video 2-10: Misleading Graphs The time series below illusrates the sales (in millions) of digital and physical msin in the UK from 2013-2017.
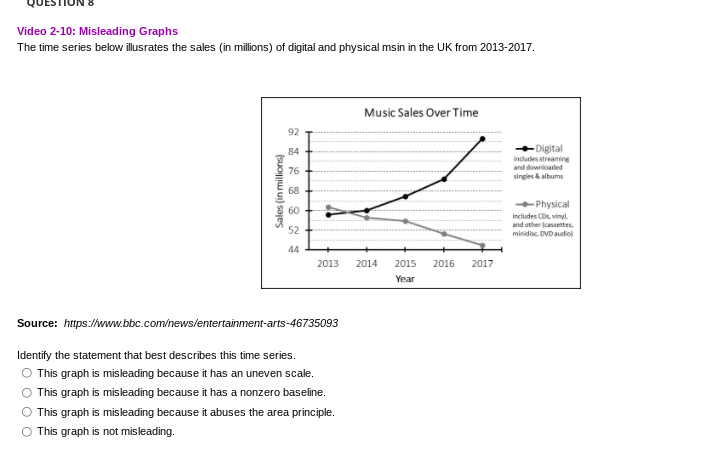
QUESTION & Video 2-10: Misleading Graphs The time series below illusrates the sales (in millions) of digital and physical msin in the UK from 2013-2017. Music Sales Over Time 92 84 -# Digital Indudes streaming and downloaded singles & albums Sales (in millions) $ 8 8 7 Physical Includes COL. vinyl and other jemmaettes, minidisc DVD audiol 44 2013 2014 2015 2016 2017 Year Source: https//www.bbc.comews/entertainment-arts-46735093 Identify the statement that best describes this time series. O This graph is misleading because it has an uneven scale. O This graph is misleading because it has a nonzero baseline. O This graph is misleading because it abuses the area principle. O This graph is not misleading
Step by Step Solution
There are 3 Steps involved in it

Get step-by-step solutions from verified subject matter experts