

Question: Question: What additional observations can we make in looking at this visualization in conjunction with the Days in Loss by Fair Value graphic below? Days
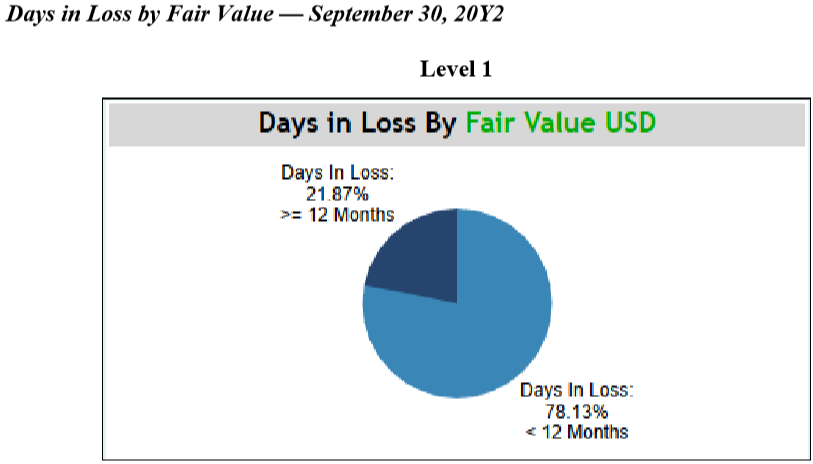
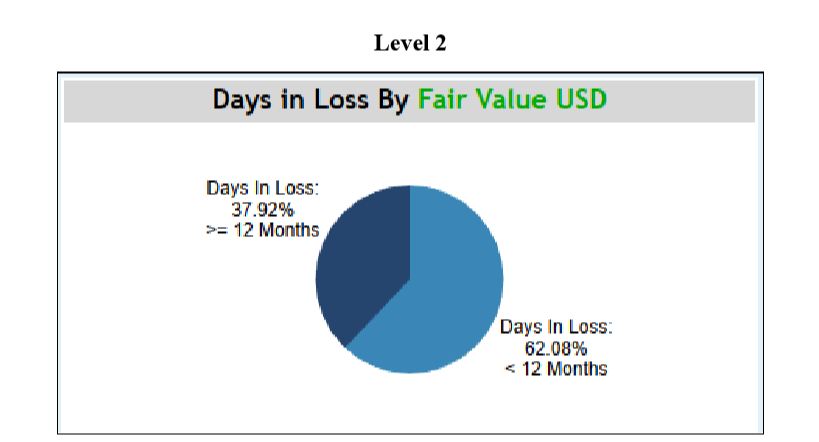
Question: What additional observations can we make in looking at this visualization in conjunction with the Days in Loss by Fair Value graphic below?
Days in Loss by Fair Value September 30, 20Y2 Level 1 Days in Loss By Fair Value USD Days In Loss: 21.87% >= 12 Months Days In Loss: 78.13% = 12 Months Days In Loss: 62.08%
Step by Step Solution
There are 3 Steps involved in it
1 Expert Approved Answer
Step: 1 Unlock

Question Has Been Solved by an Expert!
Get step-by-step solutions from verified subject matter experts
Step: 2 Unlock
Step: 3 Unlock