

Question: Question: What does the Influence Diagram look like for the given Decision Tree? Robin Pinelli is considering three job offers. In trying to decide which
Question: What does the Influence Diagram look like for the given Decision Tree?
Robin Pinelli is considering three job offers. In trying to decide which to accept, Robin has concluded that three objectives are important in this decision. First, of course, is to maximize disposable incomethe amount left after paying for housing, utilities, taxes, and other necessities. Second, Robin wants to spend more time in cold weather climates enjoying winter sports. The third objective relates to the quality of the community. Being single, Robin would like to live in a city with a lot of activities and a large population of single professionals.
Developing attributes for these three objectives turns out to be relatively straightforward.
Disposable income can be measured directly by calculating monthly takehome pay minus average monthly rent (being careful to include utilities) for an appropriate apartment. The second attribute is annual snowfall. For the third attribute, Robin has located a magazine survey of large cities that scores those cities as places for single professionals to live. Although the survey is not perfect from Robins point of view, it does capture the main elements of her concern about the quality of the singles community and available activities. Also, all three of the cities under consideration are included in the survey.
Here are descriptions of the three job offers:
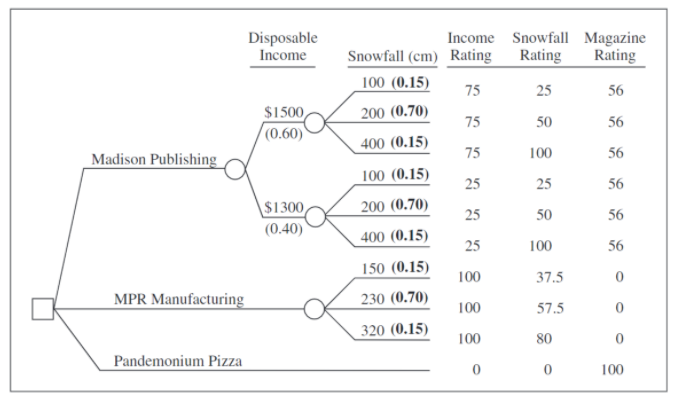
- MPR Manufacturing in Flagstaff, Arizona. Disposable income estimate: $1,600 per month. Snowfall range: 150 to 320 cm per year. Magazine score: 50 (out of 100).
- Madison Publishing in St. Paul, Minnesota. Dis-posable income estimate: $1,300 to $1,500 per month. (The uncertainty here is because Robin knows there is a wide variety in apartment rental prices and will not know what is appropriate and available until spending some time in the city.) Snowfall range: 100 to 400 cm per year. Magazine score: 75.
- Pandemonium Pizza in San Francisco, California. Disposable income estimate: $1,200 per month. Snowfall range: negligible. Magazine score: 95.
Robin has created the decision tree to represent the situation. The uncertainty about snowfall and disposable income are represented by the chance nodes as Robin has included them in the tree. The ratings in the consequence matrix are such that the worst consequence has a rating of zero points and the best has 100.
Question:
What does the Influence Diagram look like for the given Decision Tree?
Disposable Income $1500 (0.60) Madison Publishing Income Snowfall Magazine Snowfall (cm) Rating Rating Rating 100 (0.15) 75 25 56 200 (0.70) 75 50 56 400 (0.15) 75 100 56 100 (0.15) 25 25 56 200 (0.70) 25 50 56 400 (0.15) 25 56 150 (0.15) 100 37.5 0 230 (0.70) 100 57.5 0 320 (0.15) 100 80 $1300 (0.40) 100 MPR Manufacturing Pandemonium Pizza 0 0 100 Disposable Income $1500 (0.60) Madison Publishing Income Snowfall Magazine Snowfall (cm) Rating Rating Rating 100 (0.15) 75 25 56 200 (0.70) 75 50 56 400 (0.15) 75 100 56 100 (0.15) 25 25 56 200 (0.70) 25 50 56 400 (0.15) 25 56 150 (0.15) 100 37.5 0 230 (0.70) 100 57.5 0 320 (0.15) 100 80 $1300 (0.40) 100 MPR Manufacturing Pandemonium Pizza 0 0 100Step by Step Solution
There are 3 Steps involved in it

Get step-by-step solutions from verified subject matter experts