

Question: Question: What is the difference between 6 sigma and lean? AutoSave OF AAP C... Homework 4 - QC-1-1-1 Home Insert Draw Page Layout Formulas Data
Question: What is the difference between 6 sigma and lean?
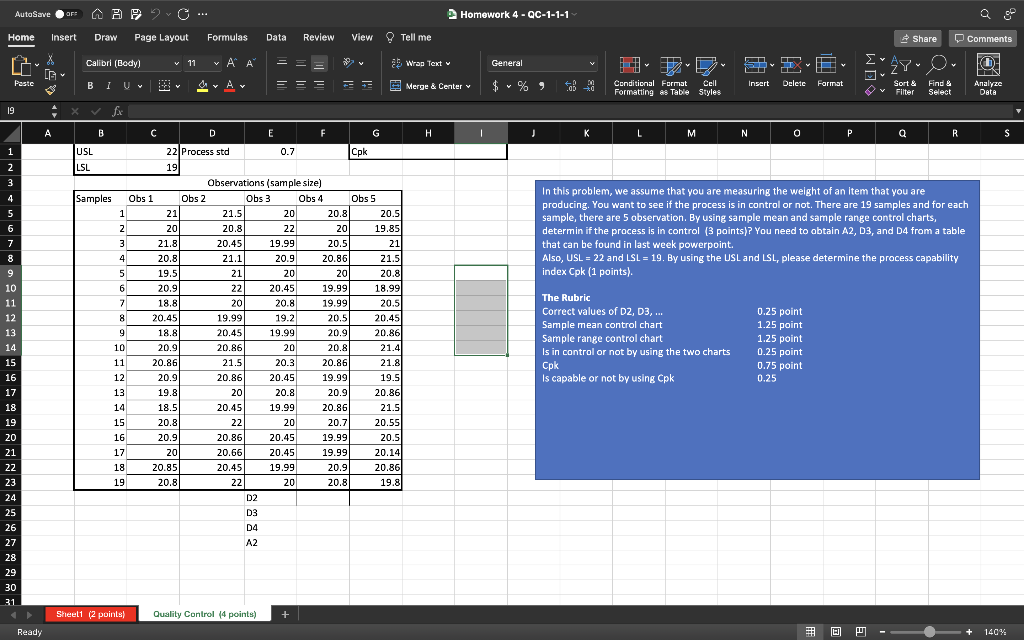
AutoSave OF AAP C... Homework 4 - QC-1-1-1 Home Insert Draw Page Layout Formulas Data Review View Tell me Share Comments Calibri (Body) v 11 X [ G VA A ab Wrap Text General FO) v Paste I U U Av - - = = = Merge & Center v Insert Y Delete $ - % Format Conditional Format Cell Formatting es Table Styles Sort & Filter Find & Select Analyze Data 19 fx A H 1 K K L M N 0 P a R S 1 2 3 4 5 6 In this problem, we assume that you are measuring the weight of an item that you are producing. You want to see if the process is in control or not. There are 19 samples and for each sample, there are 5 observation. By using sample mean and sample range control charts, determin if the process is in control (3 points)? You need to obtain A2, D3, and D4 from a table that can be found in last week powerpoint Also, USL = 22 and LSL = 19. By using the USL and LSI, please determine the process capability index Cpk (1 points) 7 8 9 10 11 12 13 B C D E F G G USL 22 Process std 0.7 Cpk LSL 19 Observations (sample size) Samples Obs 1 Obs 2 Obs 3 Obs 4 Obs 5 1 1 21 21.5 20 20.8 20.5 Z 20 20.8 22 20 19.85 3 21.8 20.45 19.99 20.5 21 4 20.8 21.1 20.9 20.86 21.5 5 19.5 21 20 20 20.8 6 6 20.9 22 20.45 19.99 18.99 7 7 18.8 20 20.8 19.99 20.5 8 20.49 19.99 19.2 20.5 20.45 9 9 18.8 20.45 19.99 20.9 20.86 10 20.9 | 20.86 20 20.8 21.4 11 20.86 21.5 20.3 20.86 21.8 12 20.9 20.86 20.45 19.99 19.5 13 19.8 20 20.8 20.9 20.86 14 18.5 20.45 19.99 20.86 21.5 15 20.8 22 20 20.7 20.55 16 20.9 20.86 20.45 19.99 20.5 17 20 20.66 20.45 19.99 20.14 18 20.95 20.45 19.99 20.91 20.86 19 20.8 22 20 20.8 19.8 D2 D3 The Rubric Correct values of D2, D3, ... Sample mean control chart Sample range control chart Is in control or not by using the two charts Cpk Is capable or not by using Cpk 0.25 point 1.25 point 1.25 point 0.25 point 0.75 point 0.25 14 15 16 17 18 19 20 21 22 23 24 25 D4 A2 26 27 28 29 30 31. Sheet1 (2 points Quality Control (4 points) + Ready + 140%Step by Step Solution
There are 3 Steps involved in it
1 Expert Approved Answer
Step: 1 Unlock

Question Has Been Solved by an Expert!
Get step-by-step solutions from verified subject matter experts
Step: 2 Unlock
Step: 3 Unlock