

Question: Question: Write a MATLAB script to visualize a 3D plot of a mathematical function, specifically the Ackley's function. Ackley's function is defined as:f(x,y)=?20exp(?0.2 ?sqrt(0.5(x^2+y^2))?exp(0.5cos(2pi x)+cos(2pi
Question: Write a MATLAB script to visualize a 3D plot of a mathematical function, specifically the "Ackley's function." Ackley's function is defined as:f(x,y)=?20exp(?0.2 ?sqrt(0.5(x^2+y^2))?exp(0.5cos(2\pi x)+cos(2\pi y))+e+20Generate a 3D surface plot for Ackley's function using x and y values in the range [?5,5]. ?Include labels for the axes and a title for the
Write a MATLAB script to visualize a D plot of a mathematical function, specifically the "Ackley's function." Ackley's function is defined as:fxandexp ?sqrtxandexpcospi xcospi yIt isGenerate a D surface plot for Ackley's function using x and y values in the range ?Include labels for the axes and a title for the plot.
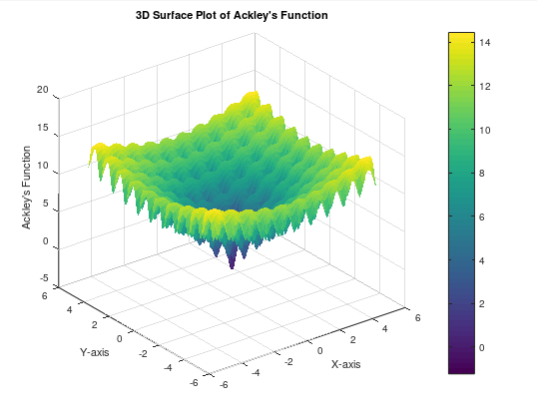
20 20 15 10 Ackley's Function 50 -5 G 4 3D Surface Plot of Ackley's Function 2 Y-axis 2 14 12 10 2 2 0 X-axis
Step by Step Solution
There are 3 Steps involved in it
1 Expert Approved Answer
Step: 1 Unlock

MATLAB CodeScript Define the Ackleys function ackley x y 20 exp02 s... View full answer
Question Has Been Solved by an Expert!
Get step-by-step solutions from verified subject matter experts
Step: 2 Unlock
Step: 3 Unlock