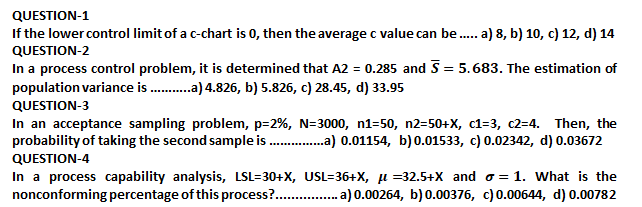
Question: = QUESTION-1 If the lower control limit of a c-chart is 0, then the average c value can be ..... a) 8, b) 10, c)

= QUESTION-1 If the lower control limit of a

= QUESTION-1 If the lower control limit of a c-chart is 0, then the average c value can be ..... a) 8, b) 10, c) 12, d) 14 QUESTION-2 In a process control problem, it is determined that A2 = 0.285 and 5 = 5.683. The estimation of population variance is ........a) 4.826, b) 5.826, c) 28.45, d) 33.95 QUESTION-3 In an acceptance sampling problem, p=2%, N=3000, n1=50, n2=50+X, c1=3, c2=4. Then, the probability of taking the second sample is...........a) 0.01154, b) 0.01533, c) 0.02342, d) 0.03672 QUESTION-4 In a process capability analysis, LSL=30+X, USL=36+X, p =32.5+X and o=1. What is the nonconforming percentage of this process?. a) 0.00264, b) 0.00376, c) 0.00644, d) 0.00782 = QUESTION-1 If the lower control limit of a c-chart is 0, then the average c value can be ..... a) 8, b) 10, c) 12, d) 14 QUESTION-2 In a process control problem, it is determined that A2 = 0.285 and 5 = 5.683. The estimation of population variance is ........a) 4.826, b) 5.826, c) 28.45, d) 33.95 QUESTION-3 In an acceptance sampling problem, p=2%, N=3000, n1=50, n2=50+X, c1=3, c2=4. Then, the probability of taking the second sample is...........a) 0.01154, b) 0.01533, c) 0.02342, d) 0.03672 QUESTION-4 In a process capability analysis, LSL=30+X, USL=36+X, p =32.5+X and o=1. What is the nonconforming percentage of this process?. a) 0.00264, b) 0.00376, c) 0.00644, d) 0.00782

Step by Step Solution

There are 3 Steps involved in it

1 Expert Approved Answer
Step: 1 Unlock blur-text-image
Question Has Been Solved by an Expert!

Get step-by-step solutions from verified subject matter experts

Step: 2 Unlock
Step: 3 Unlock

Students Have Also Explored These Related General Management Questions!