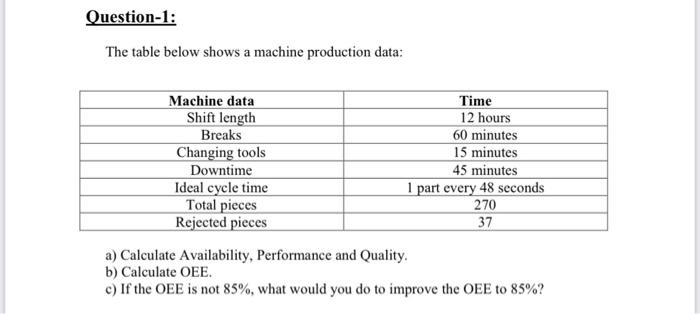
Question: Question-1: The table below shows a machine production data: Machine data Shift length Breaks Changing tools Downtime Ideal cycle time Total pieces Rejected pieces Time

Question-1: The table below shows a machine
Question-1: The table below shows a machine production data: Machine data Shift length Breaks Changing tools Downtime Ideal cycle time Total pieces Rejected pieces Time 12 hours 60 minutes 15 minutes 45 minutes 1 part every 48 seconds 270 37 a) Calculate Availability, Performance and Quality b) Calculate OEE. c) If the OEE is not 85%, what would you do to improve the OEE to 85%

Step by Step Solution

There are 3 Steps involved in it

1 Expert Approved Answer
Step: 1 Unlock blur-text-image
Question Has Been Solved by an Expert!

Get step-by-step solutions from verified subject matter experts

Step: 2 Unlock
Step: 3 Unlock

Students Have Also Explored These Related General Management Questions!