

Question: Question1 This is not a form; we suggest that you use the browse mode and read all parts of the question carefully. The distribution of
Question1
This is not a form; we suggest that you use the browse mode and read all parts of the question carefully.
The distribution of the amount of money spent by students for textbooks in a semester is approximately normal in shape with a mean of $235 and a standard deviation of $20.
According to the Standard Deviation Rule, in a semester, most (95%) of the students spent on textbooks:
between 215 and 255 dollars.
between 195 and 275 dollars.
between 175 and 295 dollars.
less than 215 dollars or more than 255 dollars.
above 235 dollars.
Question2
The histogram below displays the distribution of exam scores for 40 students in an elementary statistics course.
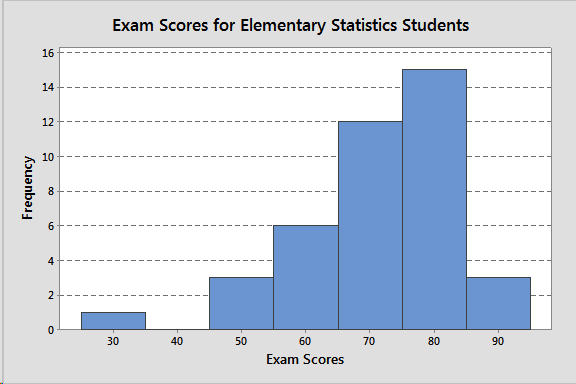


Exam Scores for Elementary Statistics Students 16 14 12 10 Frequency 8 6 4 2 30 40 50 60 70 80 90 Exam ScoresMetropolis Location Suburbia O 10 20 30 40 50 60 Cost of Vehicle (Thousands of Dollars)Metropolis Location Suburbia O 10 20 30 40 50 60 Cost of Vehicle (Thousands of Dollars)Metropolis Location Suburbia O 10 20 30 40 50 60 Cost of Vehicle (Thousands of Dollars)Metropolis Location Suburbia O 10 20 30 40 50 60 Cost of Vehicle (Thousands of Dollars)
Step by Step Solution
There are 3 Steps involved in it

Get step-by-step solutions from verified subject matter experts