

Question: Question:Compare Amazon's ratio data with industry's ratios data. For example: ROE was calculated by net income divided by equity. Amazon's ROE is fluctuating from 2008
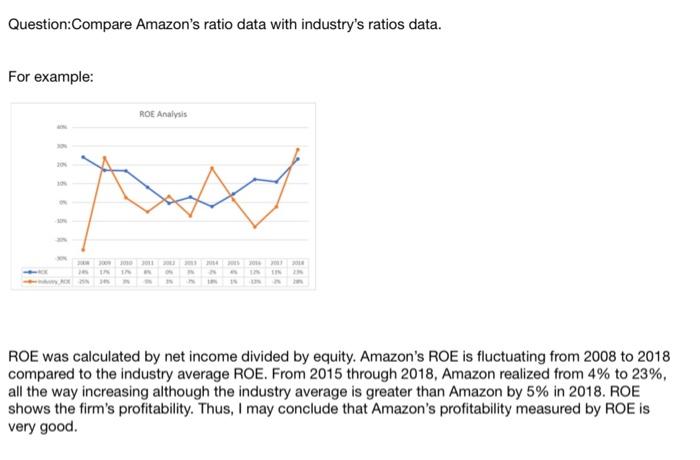
Question:Compare Amazon's ratio data with industry's ratios data. For example: ROE was calculated by net income divided by equity. Amazon's ROE is fluctuating from 2008 to 2018 compared to the industry average ROE. From 2015 through 2018, Amazon realized from 4% to 23%, all the way increasing although the industry average is greater than Amazon by 5% in 2018. ROE shows the firm's profitability. Thus, I may conclude that Amazon's profitability measured by ROE is very good. Question:Compare Amazon's ratio data with industry's ratios data. For example: ROE was calculated by net income divided by equity. Amazon's ROE is fluctuating from 2008 to 2018 compared to the industry average ROE. From 2015 through 2018, Amazon realized from 4% to 23%, all the way increasing although the industry average is greater than Amazon by 5% in 2018. ROE shows the firm's profitability. Thus, I may conclude that Amazon's profitability measured by ROE is very good
Step by Step Solution
There are 3 Steps involved in it

Get step-by-step solutions from verified subject matter experts