

Question: This regression is made using Minitab software. Question: i. Use the t test and a = 0.05 to test the hypothesis H0: H1 = 0
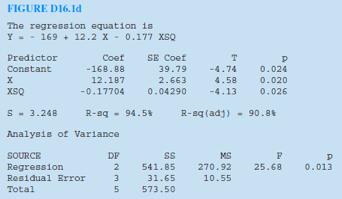
This regression is made using Minitab software.
Question:
i. Use the t test and a = 0.05 to test the hypothesis H0: H1 = 0 and H0: H2 = 0.
ii. Determine the SSE value.
RELATIONSHIPS BETWEEN SST, SSR, AND SSE
SST = SSR + SSE
iii. Determine the value of R2 and explain its meaning. R2 = SSR/SST
FIGURE D16.Id The regression equation ia Y - - 169 + 12.2 x - 0.177 XXSQ Predictor Coef SE Coef T Constant -168.88 39.79 -4.74 0.024 12.187 2.663 4.58 0.020 XSQ -0.17704 0.04290 -4.13 0.026 S- 3.248 R-aq - 94.5% R-aq (adj) - 90.8 Analysis of Variance SOURCE DF MS 270.92 Regression Residual Error 2 541.85 25.68 0.013 31.65 10.55 Total 573.50
Step by Step Solution
3.41 Rating (148 Votes )
There are 3 Steps involved in it
Q1a Using t test to test for the significance of the coefficient H0 B1 0 Vs H1 B1 not 0 H0 B2 0 Vs H1 B2 not 0 We make our decision using the p value ... View full answer

Get step-by-step solutions from verified subject matter experts