

Question: Questions 1 - 4 refer to the graph below. At Markwood Elementary the 2nd graders collected data on the number of siblings each student had.
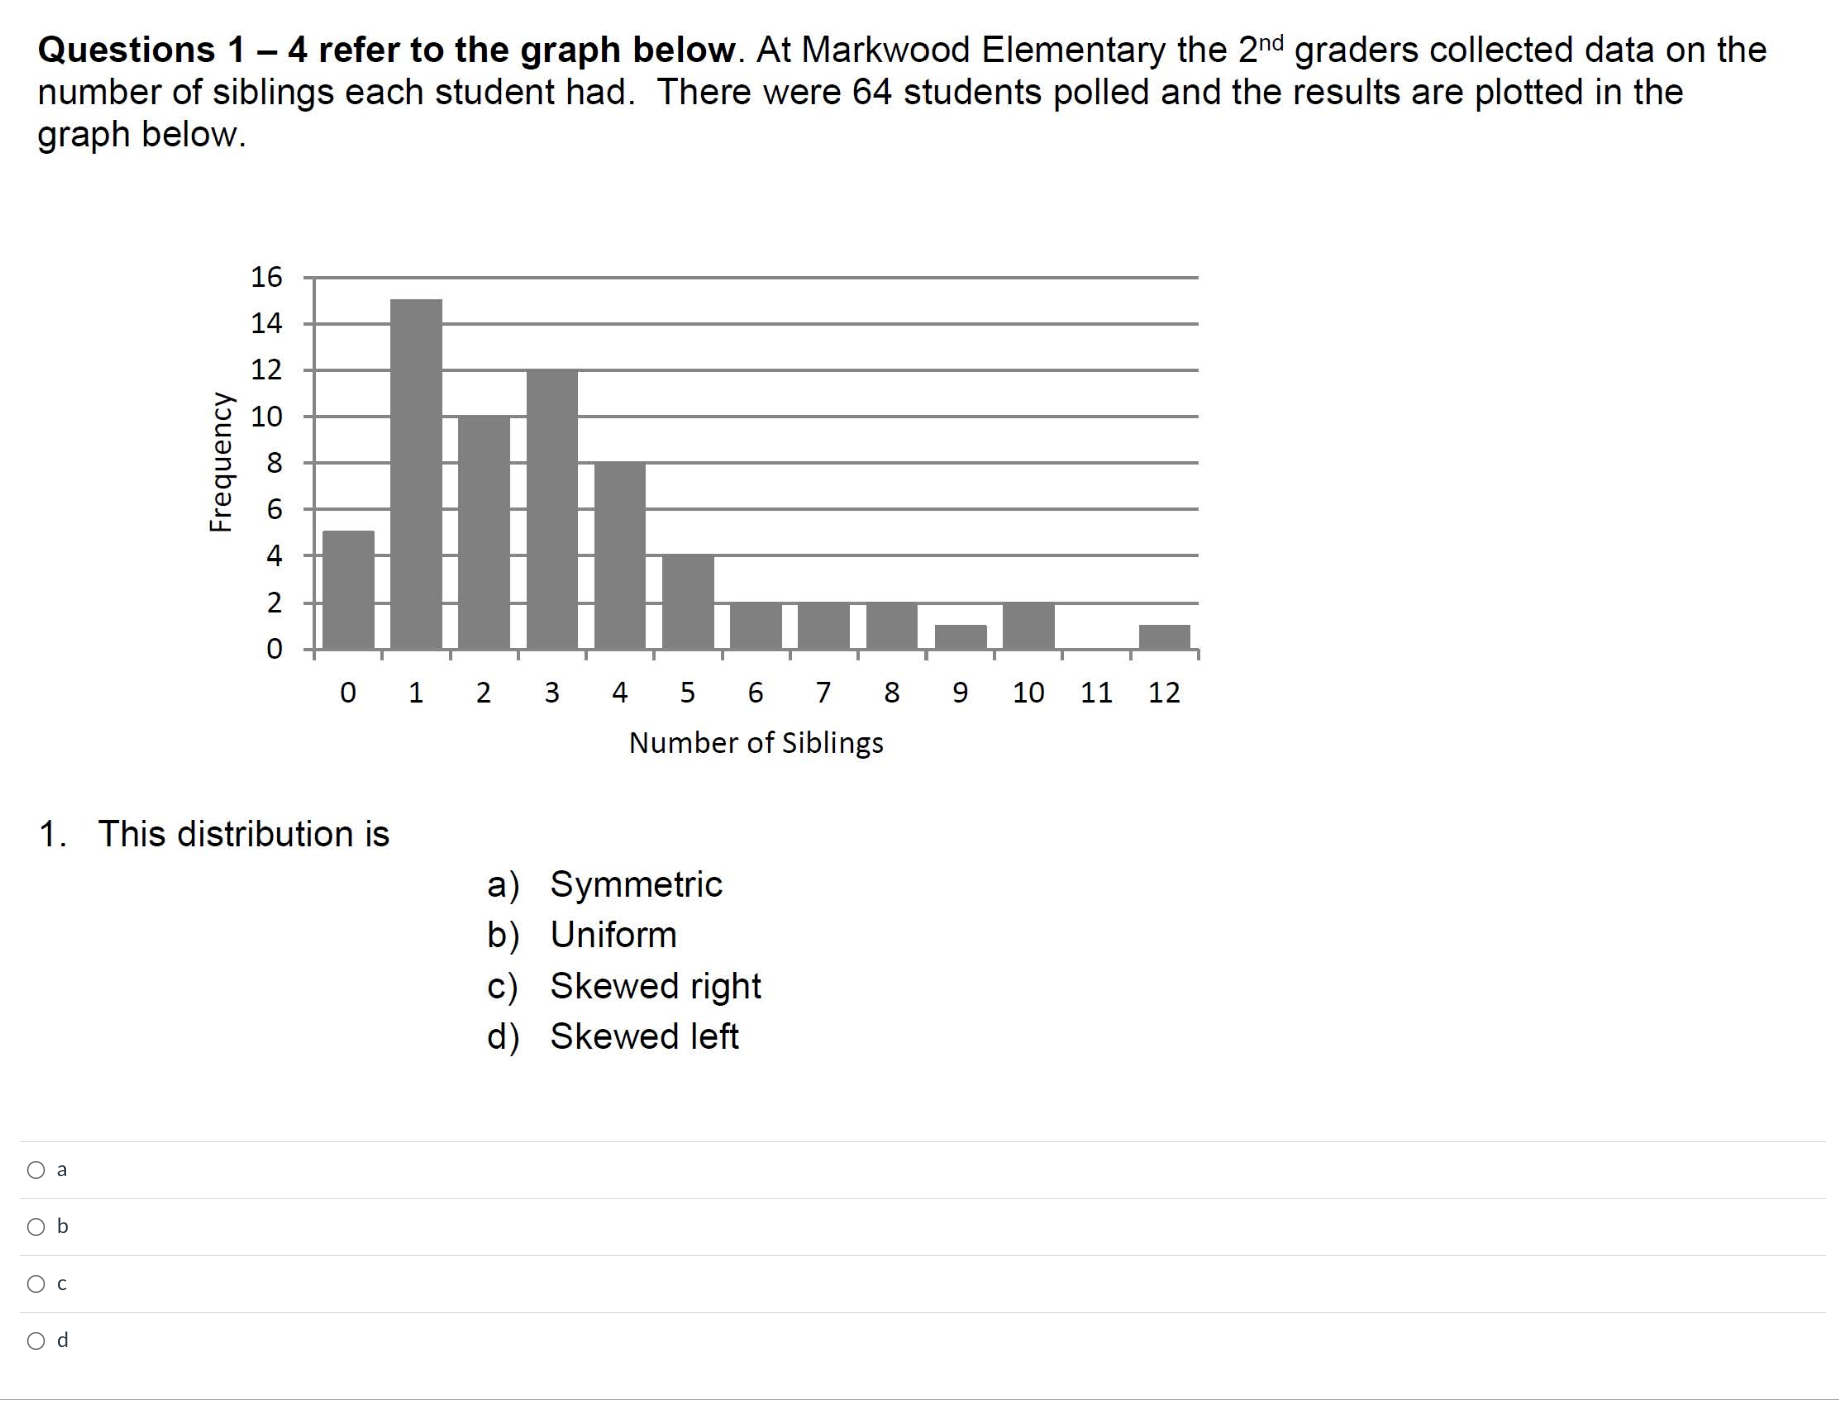
Questions 1 - 4 refer to the graph below. At Markwood Elementary the 2nd graders collected data on the number of siblings each student had. There were 64 students polled and the results are plotted in the graph below. 16 14 Frequency 0 1 2 3 4 5 6 7 8 9 10 11 12 Number of Siblings 1. This distribution is a) Symmetric b) Uniform c) Skewed right d) Skewed left O a Ob O c O d
Step by Step Solution
There are 3 Steps involved in it
1 Expert Approved Answer
Step: 1 Unlock

Question Has Been Solved by an Expert!
Get step-by-step solutions from verified subject matter experts
Step: 2 Unlock
Step: 3 Unlock