

Question: Questions 1 - 5 Two-Sample T Tests for GPA by Gender Gender N Mean SD SE Female 27 3. 3977 0 . 4220 0. 0428
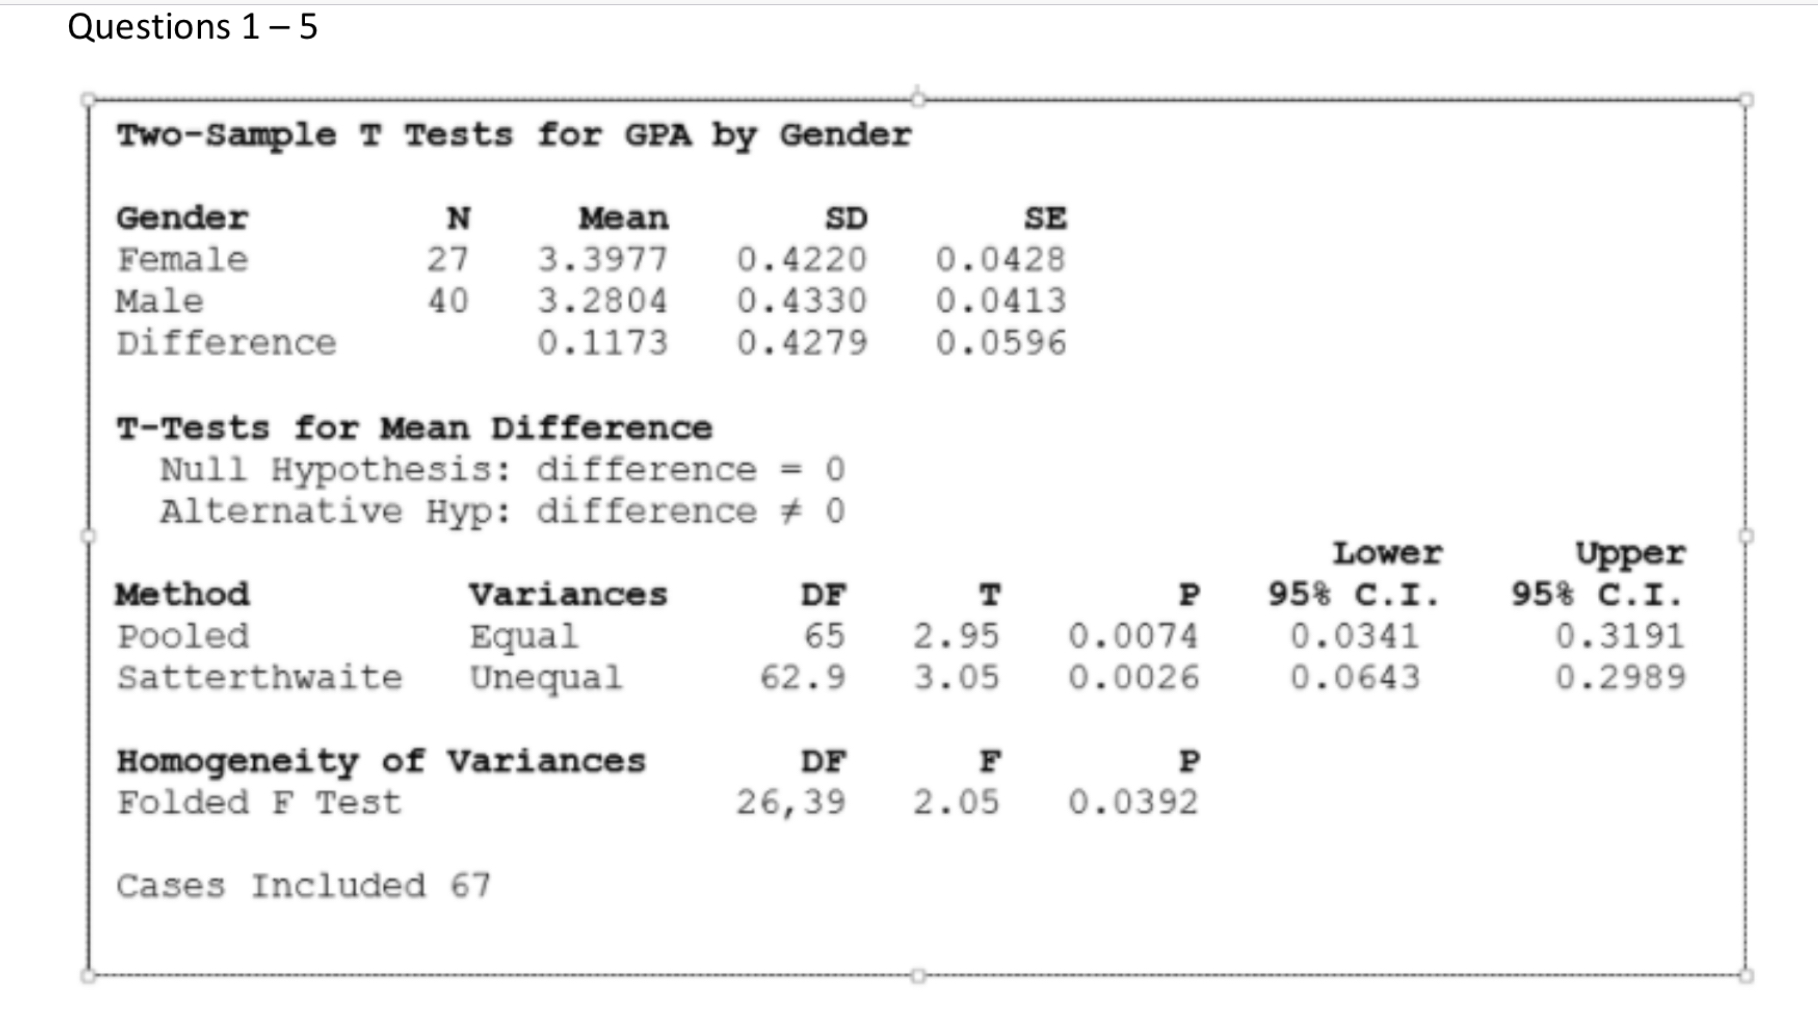
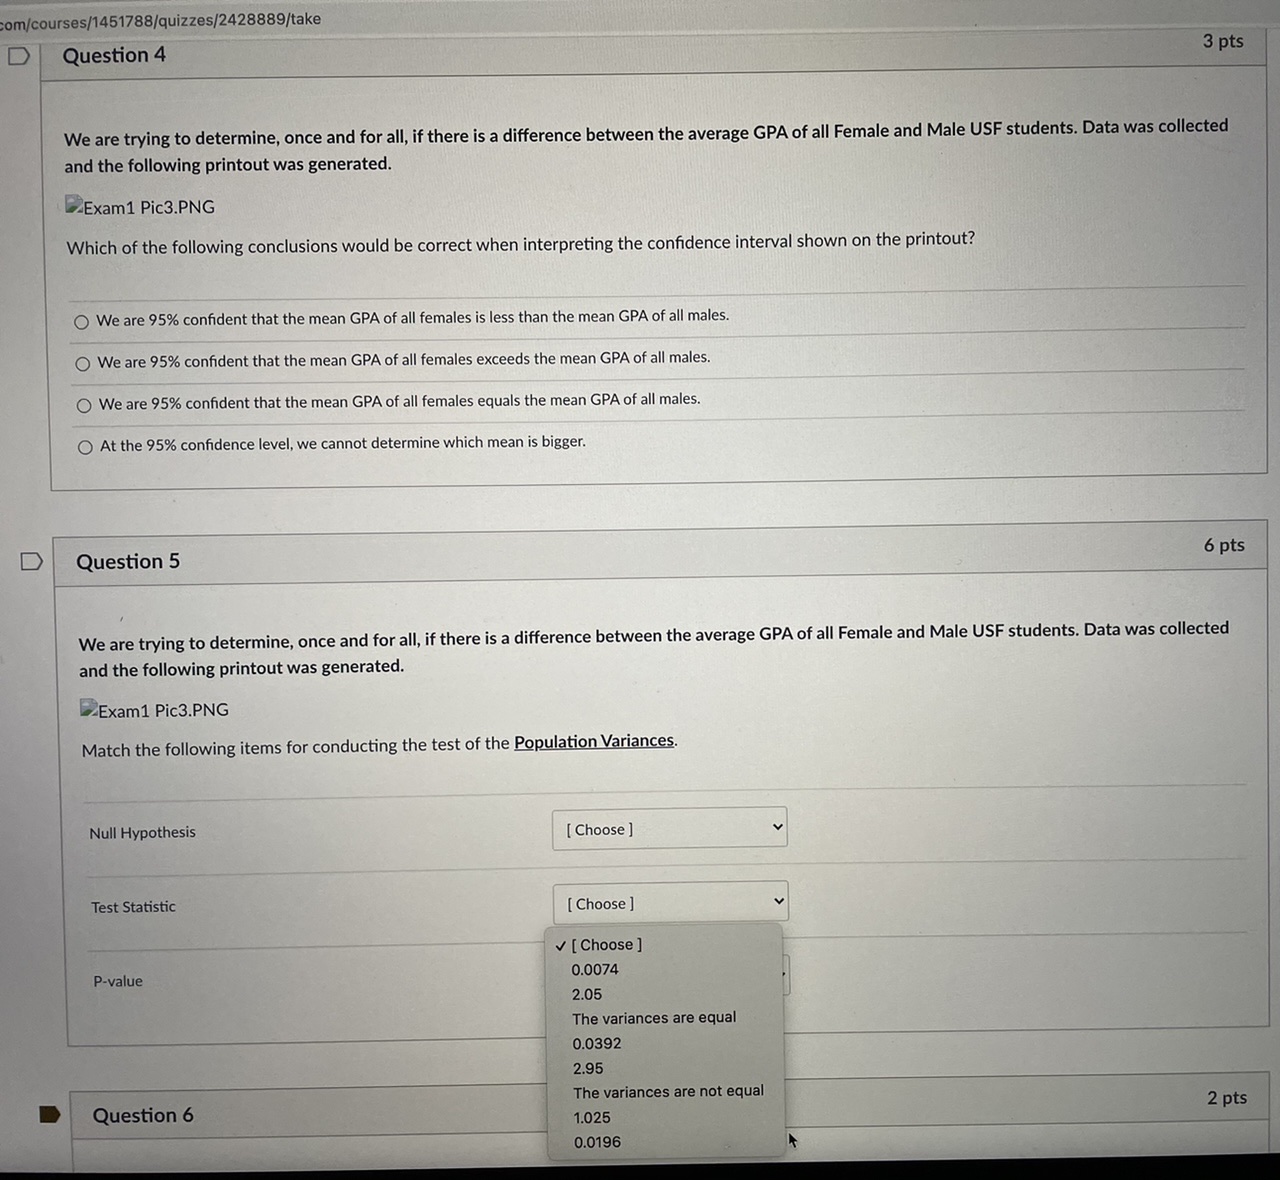
Questions 1 - 5 Two-Sample T Tests for GPA by Gender Gender N Mean SD SE Female 27 3. 3977 0 . 4220 0. 0428 Male 40 3.2804 0. 4330 0. 0413 Difference 0. 1173 0. 4279 0 . 0596 T-Tests for Mean Difference Null Hypothesis: difference = 0 Alternative Hyp: difference # 0 Lower Upper Method Variances DF T P 95% C. I. 95% C.I. Pooled Equal 65 2. 95 0. 0074 0. 0341 0. 3191 Satterthwaite Unequal 62.9 3. 05 0 . 0026 0. 0643 0.2989 Homogeneity of Variances DF F P Folded F Test 26,39 2. 05 0. 0392 Cases Included 67com/courses/1451788/quizzes/2428889/take D Question 4 3 pts We are trying to determine, once and for all, if there is a difference between the average GPA of all Female and Male USF students. Data was collected and the following printout was generated. Exam1 Pic3.PNG Which of the following conclusions would be correct when interpreting the confidence interval shown on the printout? We are 95% confident that the mean GPA of all females is less than the mean GPA of all males. O We are 95% confident that the mean GPA of all females exceeds the mean GPA of all males. We are 95% confident that the mean GPA of all females equals the mean GPA of all males. O At the 95% confidence level, we cannot determine which mean is bigger. D Question 5 6 pts We are trying to determine, once and for all, if there is a difference between the average GPA of all Female and Male USF students. Data was collected and the following printout was generated. Exam1 Pic3.PNG Match the following items for conducting the test of the Population Variances. Null Hypothesis [ Choose ] Test Statistic Choose ] [ Choose ] P-value 0.0074 2.05 The variances are equal 0.0392 2.95 The variances are not equal Question 6 2 pts 1.025 0.0196
Step by Step Solution
There are 3 Steps involved in it

Get step-by-step solutions from verified subject matter experts