

Question: Questions 1 6 through 2 0 The below table shows income ( in thousand dollars ) of 2 1 workers at different ages ( in
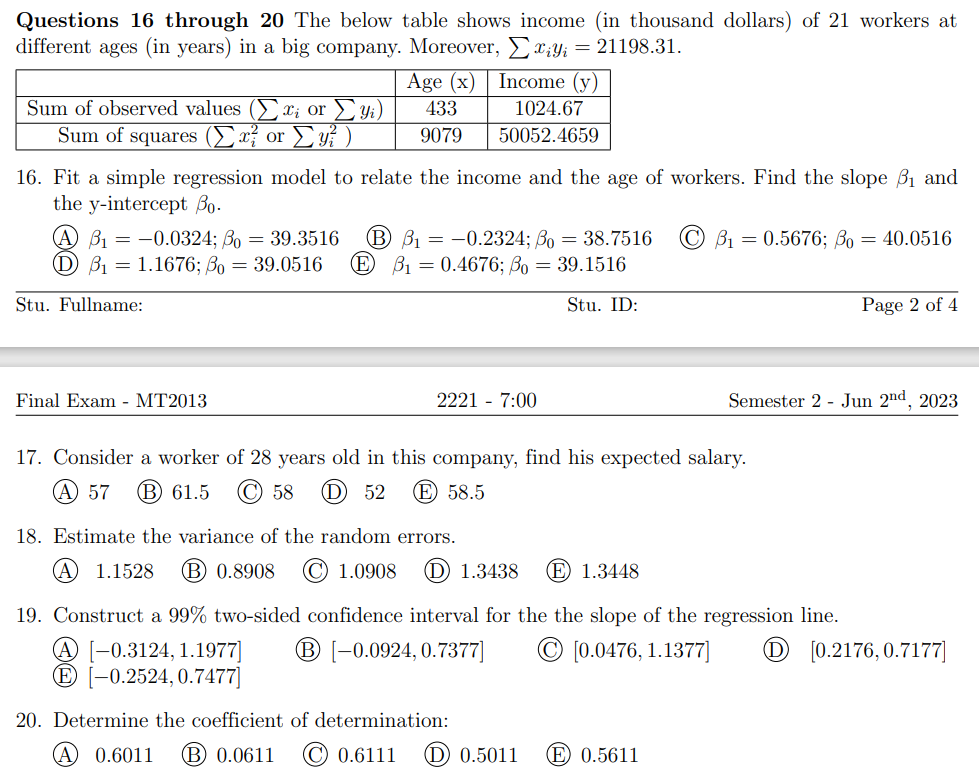
Questions through The below table shows income in thousand dollars of workers at
different ages in years in a big company. Moreover,
Fit a simple regression model to relate the income and the age of workers. Find the slope and
the yintercept
A;
B;
C;
D;
E;
Consider a worker of years old in this company, find his expected salary.
A
B
C
D
E
Estimate the variance of the random errors.
A
B
C
D
E
Construct a twosided confidence interval for the the slope of the regression line.
A
B
C
D
E
Determine the coefficient of determination:
A
B
C
D
E
Step by Step Solution
There are 3 Steps involved in it
1 Expert Approved Answer
Step: 1 Unlock

Question Has Been Solved by an Expert!
Get step-by-step solutions from verified subject matter experts
Step: 2 Unlock
Step: 3 Unlock