

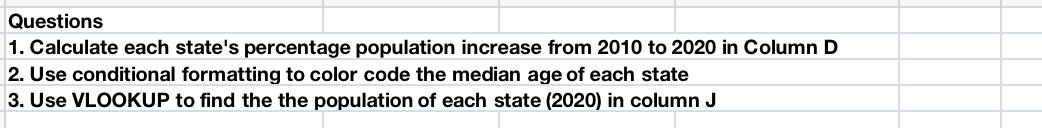
Questions 1. Calculate each state's percentage population increase from 2010 to 2020 in Column D 2....
Fantastic news! We've Found the answer you've been seeking!
Question:
Transcribed Image Text:
Questions 1. Calculate each state's percentage population increase from 2010 to 2020 in Column D 2. Use conditional formatting to color code the median age of each state 3. Use VLOOKUP to find the the population of each state (2020) in column J State Utah Idaho Texas North Dakota Nevada Colorado Population 2020 Population 2010 Population Change% 3,271,616 2,763,885 16% (B7-C7)/B7 1,839,106 29,145,505 1,567,582 15% (B8-C8)/B8 State Alabama Alaska Median ag 39.5 35.3 25,145,561 14% (B9-C9)/B9 Arizona 38.5 779,094 672,591 14% (B10-C10)/B10 Arkansas 38.6 3,104,614 2,700,551 13% (B11-C11)/B11 California 37.3 5,773,714 5,029,196 13% (B12-C12)/B12 Colorado 37.3 Washington 7,705,281 6,724,540 13% (B13-C13)/B13 Connecticut 41.2 Florida 21,538,187 18,801,310 13% (B14-C14)/B14 Delaware 41.4 Arizona 7,151,502 6,392,017 11% (B15-C15)/B15 Florida 42.7 South Carolina 5,118,425 4,625,364 Oregon 4,237,256 3,831,074 Georgia Delaware 10,711,908 9,687,653 10% (B16-C16)/B16 10% (B17-C17)/B17 10% (B18-C18)/B18 Georgia 37.3 Hawaii 40 Idaho 37.2 Montana 989,948 1,084,225 897,934 9% (B19-C19)/B19 Illinois 38.8 989,415 9% (B20-C20)/B20 Indiana 38 North Carolina 10,439,388 9,535,483 9% (B21-C21)/B21 Iowa 38.6 South Dakota Tennessee Virginia 886,667 6,910,840 814,180 8% (B22-C22)/B22 Kansas 37.3 6,346,105 8% (B23-C23)/B23 Kentucky 39.2 8,631,393 8,001,024 7% (B24-C24)/B24 Louisiana 37.8 Minnesota 5,706,494 5,303,925 7% (B25-C25)/B25 Maine 45 Nebraska 1,961,504 1,826,341 7% =(B26-C26)/B26 Maryland 39.2 Massachusetts 7,029,917 6,547,629 7% (B27-C27)/B27 Massachusetts 39.7 Maryland 6,177,224 5,773,552 Hawaii 1,455,271 1,360,301 7% (B28-C28)/B28 7% (B29-C29)/B29 Michigan 40.1 Minnesota 38.5 California 39,538,223 37,253,956 6% (B30-C30)/B30 Mississippi 38.3 New Jersey 9,288,994 8,791,894 5% (B31-C31)/B31 Missouri 39.1 Oklahoma 3,959,353 3,751,351 5% (B32-C32)/B32 Montana 40.2 Alabama 5,024,279 4,779,736 5% (B33-C33)/B33 Nebraska 36.9 Iowa 3,190,369 3,046,355 5% (B34-C34)/B34 Nevada 38.5 Indiana 6,785,528 6,483,802 4% (B35-C35)/B35 New Hampshire 43.1 New Hampshire 1,377,529 1,316,470 4% (B36-C36)/B36 New Jersey 40.2 Rhode Island 1,097,379 1,052,567 4% (B37-C37)/B37 New Mexico 38.6 New York 20,201,249 19,378,102 Kentucky 4,505,836 Wisconsin Arkansas 5,893,718 4,339,367 5,686,986 3,011,524 2,915,918 Alaska 733,391 Kansas 2.937,880 New Mexico 2.117,522 710,231 2.853,118 2.059,179 Missouri 6.154,913 5,988,927 Vermont 643,077 Louisiana 4.657,757 625,741 4,533,372 3% (B43-C43)/B43 3% 3% |=(B45-C45)/B45 3% (B44-C44)/B44 4% (B38-C38)/B38 4% (B39-C39)/B39 4% |=(B40-C40/B40 3% |=(B41-C41)/B41 3% (B42-C42)/B42 Ohio Oklahoma Oregon Pennsylvania New York 39.4 North Carolina 39.2 North Dakota 35.4 39.6 37.1 39.9 40.9 Rhode Island 40.3 (B46-C46)/B46 South Carolina 40.1 3% (B47-C47)/B47 South Dakota 37.6 Maine 1,362,359 1.328,361 2% (B48-C48)/B48 Tennessee 39.1 Pennsylvania 13,002,700 12,702,379 2% (B49-C49)/B49 Texas 35.2 Wyoming Ohio Michigan Connecticut Illinois 576,851 11,799,448 10.077.331 563.626 2% (B50-C50)/B50 11,536,504 9.883,640 3.605,944 3,574,097 2% (B51-C51)/B51 2% (B52-C52)/B52 1% (B53-C53)/B53 Utah Vermont 31.5 43 Virginia 38.7 Washington 37.9 12.812.508 12,830.632 0% (B54-C54)/B54 West Virginia 43 Mississippi 2,961,279 2,967,297 West Virginia 1,793,716 1.852,994 0% (B55-C55)/B55 -3% =(B56-C56)/B56 Wisconsin 40 Wyoming 38.7 Population 2020 35.3 =VLOOKUP(H6,$H$7:$I$56,2,TRUE) 39.5 =VLOOKUP(H7,$H$7:$I$56,2,TRUE) 35.3 =VLOOKUP(H8, $H$7:$I$56,2,TRUE) 38.5 =VLOOKUP(H9,$H$7:$I$56,2,TRUE) 38.6 =VLOOKUP(H10,$H$7:$I$56,2,TRUE) 37.3=VLOOKUP(H11,$H$7:$I$56,2,TRUE) 37.3 =VLOOKUP(H12,$H$7:$I$56,2,TRUE) 41.2 =VLOOKUP(H13, $H$7:$I$56,2,TRUE) 41.4 =VLOOKUP(H14, $H$7:$I$56,2,TRUE) 42.7 =VLOOKUP(H15,$H$7:$I$56,2,TRUE) 37.3 =VLOOKUP(H16,$H$7:$I$56,2,TRUE) 40 =VLOOKUP(H17,$H$7:$I$56,2,TRUE) 37.2 =VLOOKUP(H18,$H$7:$I$56,2,TRUE) 38.8=VLOOKUP(H19,$H$7:$I$56,2,TRUE) 38 =VLOOKUP(H20,$H$7:$I$56,2,TRUE) 38.6 =VLOOKUP(H21,$H$7:$I$56,2,TRUE) 37.3 =VLOOKUP(H22,$H$7:$I$56,2,TRUE) 39.2 =VLOOKUP(H23,$H$7:$I$56,2,TRUE) 37.8=VLOOKUP(H24, $H$7:$I$56,2,TRUE) 45 VLOOKUP(H25,$H$7:$I$56,2,TRUE) 39.2 =VLOOKUP(H26,$H$7:$I$56,2,TRUE) 39.7 =VLOOKUP(H27,$H$7:$I$56,2,TRUE) 40.1 =VLOOKUP(H28,$H$7:$I$56,2,TRUE) 38.5 =VLOOKUP(H29, $H$7:$I$56,2,TRUE) 38.3=VLOOKUP(H30,$H$7:$I$56,2,TRUE) 39.1 =VLOOKUP(H31,$H$7:$I$56,2,TRUE) 40.2 =VLOOKUP(H32,$H$7:$I$56,2,TRUE) 36.9 VLOOKUP(H33,$H$7:$I$56,2,TRUE) 38.5=VLOOKUP(H34,$H$7:$I$56,2,TRUE) 43.1 =VLOOKUP(H35,$H$7:$I$56,2,TRUE) 40.2 =VLOOKUP(H36,$H$7:$I$56,2,TRUE) 38.6 =VLOOKUP(H37, $H$7:$I$56,2,TRUE) 39.4 =VLOOKUP(H38, $H$7:$I$56,2,TRUE) 39.2 =VLOOKUP(H39, $H$7:$I$56,2,TRUE) 35.4 =VLOOKUP(H40,$H$7:$I$56,2,TRUE) 39.6 =VLOOKUP(H41,$H$7:$I$56,2,TRUE) 37.1 =VLOOKUP(H42.$H$7:$I$56,2,TRUE) 39.9=VLOOKUP(H43.$H$7:$I$56.2,TRUE) 40.9=VLOOKUP(H44.$H$7:$I$56.2,TRUE) 40.3 =VLOOKUP(H45.$H$7:$I$56,2,TRUE) 40.1 =VLOOKUP(H46.$H$7:$I$56,2,TRUE) 37.6 =VLOOKUP(H47.$H$7:$I$56.2.TRUE) 39.1 =VLOOKUP(H48.$H$7:$I$56.2,TRUE) 35.2 =VLOOKUP(H49.$H$7:$I$56,2,TRUE) 31.5=VLOOKUP(H50.$H$7:$I$56.2,TRUE) 43 VLOOKUP(H51.$H$7:$I$56,2,TRUE) 38.7=VLOOKUP(H52.$H$7:$I$56.2.TRUE) 37.9=VLOOKUP(H53.$H$7:$I$56.2,TRUE) 43 =VLOOKUP(H54.$H$7:$I$56,2,TRUE) 40=VLOOKUP(H55.$H$7:$I$56,2,TRUE) Questions 1. Calculate each state's percentage population increase from 2010 to 2020 in Column D 2. Use conditional formatting to color code the median age of each state 3. Use VLOOKUP to find the the population of each state (2020) in column J State Utah Idaho Texas North Dakota Nevada Colorado Population 2020 Population 2010 Population Change% 3,271,616 2,763,885 16% (B7-C7)/B7 1,839,106 29,145,505 1,567,582 15% (B8-C8)/B8 State Alabama Alaska Median ag 39.5 35.3 25,145,561 14% (B9-C9)/B9 Arizona 38.5 779,094 672,591 14% (B10-C10)/B10 Arkansas 38.6 3,104,614 2,700,551 13% (B11-C11)/B11 California 37.3 5,773,714 5,029,196 13% (B12-C12)/B12 Colorado 37.3 Washington 7,705,281 6,724,540 13% (B13-C13)/B13 Connecticut 41.2 Florida 21,538,187 18,801,310 13% (B14-C14)/B14 Delaware 41.4 Arizona 7,151,502 6,392,017 11% (B15-C15)/B15 Florida 42.7 South Carolina 5,118,425 4,625,364 Oregon 4,237,256 3,831,074 Georgia Delaware 10,711,908 9,687,653 10% (B16-C16)/B16 10% (B17-C17)/B17 10% (B18-C18)/B18 Georgia 37.3 Hawaii 40 Idaho 37.2 Montana 989,948 1,084,225 897,934 9% (B19-C19)/B19 Illinois 38.8 989,415 9% (B20-C20)/B20 Indiana 38 North Carolina 10,439,388 9,535,483 9% (B21-C21)/B21 Iowa 38.6 South Dakota Tennessee Virginia 886,667 6,910,840 814,180 8% (B22-C22)/B22 Kansas 37.3 6,346,105 8% (B23-C23)/B23 Kentucky 39.2 8,631,393 8,001,024 7% (B24-C24)/B24 Louisiana 37.8 Minnesota 5,706,494 5,303,925 7% (B25-C25)/B25 Maine 45 Nebraska 1,961,504 1,826,341 7% =(B26-C26)/B26 Maryland 39.2 Massachusetts 7,029,917 6,547,629 7% (B27-C27)/B27 Massachusetts 39.7 Maryland 6,177,224 5,773,552 Hawaii 1,455,271 1,360,301 7% (B28-C28)/B28 7% (B29-C29)/B29 Michigan 40.1 Minnesota 38.5 California 39,538,223 37,253,956 6% (B30-C30)/B30 Mississippi 38.3 New Jersey 9,288,994 8,791,894 5% (B31-C31)/B31 Missouri 39.1 Oklahoma 3,959,353 3,751,351 5% (B32-C32)/B32 Montana 40.2 Alabama 5,024,279 4,779,736 5% (B33-C33)/B33 Nebraska 36.9 Iowa 3,190,369 3,046,355 5% (B34-C34)/B34 Nevada 38.5 Indiana 6,785,528 6,483,802 4% (B35-C35)/B35 New Hampshire 43.1 New Hampshire 1,377,529 1,316,470 4% (B36-C36)/B36 New Jersey 40.2 Rhode Island 1,097,379 1,052,567 4% (B37-C37)/B37 New Mexico 38.6 New York 20,201,249 19,378,102 Kentucky 4,505,836 Wisconsin Arkansas 5,893,718 4,339,367 5,686,986 3,011,524 2,915,918 Alaska 733,391 Kansas 2.937,880 New Mexico 2.117,522 710,231 2.853,118 2.059,179 Missouri 6.154,913 5,988,927 Vermont 643,077 Louisiana 4.657,757 625,741 4,533,372 3% (B43-C43)/B43 3% 3% |=(B45-C45)/B45 3% (B44-C44)/B44 4% (B38-C38)/B38 4% (B39-C39)/B39 4% |=(B40-C40/B40 3% |=(B41-C41)/B41 3% (B42-C42)/B42 Ohio Oklahoma Oregon Pennsylvania New York 39.4 North Carolina 39.2 North Dakota 35.4 39.6 37.1 39.9 40.9 Rhode Island 40.3 (B46-C46)/B46 South Carolina 40.1 3% (B47-C47)/B47 South Dakota 37.6 Maine 1,362,359 1.328,361 2% (B48-C48)/B48 Tennessee 39.1 Pennsylvania 13,002,700 12,702,379 2% (B49-C49)/B49 Texas 35.2 Wyoming Ohio Michigan Connecticut Illinois 576,851 11,799,448 10.077.331 563.626 2% (B50-C50)/B50 11,536,504 9.883,640 3.605,944 3,574,097 2% (B51-C51)/B51 2% (B52-C52)/B52 1% (B53-C53)/B53 Utah Vermont 31.5 43 Virginia 38.7 Washington 37.9 12.812.508 12,830.632 0% (B54-C54)/B54 West Virginia 43 Mississippi 2,961,279 2,967,297 West Virginia 1,793,716 1.852,994 0% (B55-C55)/B55 -3% =(B56-C56)/B56 Wisconsin 40 Wyoming 38.7 Population 2020 35.3 =VLOOKUP(H6,$H$7:$I$56,2,TRUE) 39.5 =VLOOKUP(H7,$H$7:$I$56,2,TRUE) 35.3 =VLOOKUP(H8, $H$7:$I$56,2,TRUE) 38.5 =VLOOKUP(H9,$H$7:$I$56,2,TRUE) 38.6 =VLOOKUP(H10,$H$7:$I$56,2,TRUE) 37.3=VLOOKUP(H11,$H$7:$I$56,2,TRUE) 37.3 =VLOOKUP(H12,$H$7:$I$56,2,TRUE) 41.2 =VLOOKUP(H13, $H$7:$I$56,2,TRUE) 41.4 =VLOOKUP(H14, $H$7:$I$56,2,TRUE) 42.7 =VLOOKUP(H15,$H$7:$I$56,2,TRUE) 37.3 =VLOOKUP(H16,$H$7:$I$56,2,TRUE) 40 =VLOOKUP(H17,$H$7:$I$56,2,TRUE) 37.2 =VLOOKUP(H18,$H$7:$I$56,2,TRUE) 38.8=VLOOKUP(H19,$H$7:$I$56,2,TRUE) 38 =VLOOKUP(H20,$H$7:$I$56,2,TRUE) 38.6 =VLOOKUP(H21,$H$7:$I$56,2,TRUE) 37.3 =VLOOKUP(H22,$H$7:$I$56,2,TRUE) 39.2 =VLOOKUP(H23,$H$7:$I$56,2,TRUE) 37.8=VLOOKUP(H24, $H$7:$I$56,2,TRUE) 45 VLOOKUP(H25,$H$7:$I$56,2,TRUE) 39.2 =VLOOKUP(H26,$H$7:$I$56,2,TRUE) 39.7 =VLOOKUP(H27,$H$7:$I$56,2,TRUE) 40.1 =VLOOKUP(H28,$H$7:$I$56,2,TRUE) 38.5 =VLOOKUP(H29, $H$7:$I$56,2,TRUE) 38.3=VLOOKUP(H30,$H$7:$I$56,2,TRUE) 39.1 =VLOOKUP(H31,$H$7:$I$56,2,TRUE) 40.2 =VLOOKUP(H32,$H$7:$I$56,2,TRUE) 36.9 VLOOKUP(H33,$H$7:$I$56,2,TRUE) 38.5=VLOOKUP(H34,$H$7:$I$56,2,TRUE) 43.1 =VLOOKUP(H35,$H$7:$I$56,2,TRUE) 40.2 =VLOOKUP(H36,$H$7:$I$56,2,TRUE) 38.6 =VLOOKUP(H37, $H$7:$I$56,2,TRUE) 39.4 =VLOOKUP(H38, $H$7:$I$56,2,TRUE) 39.2 =VLOOKUP(H39, $H$7:$I$56,2,TRUE) 35.4 =VLOOKUP(H40,$H$7:$I$56,2,TRUE) 39.6 =VLOOKUP(H41,$H$7:$I$56,2,TRUE) 37.1 =VLOOKUP(H42.$H$7:$I$56,2,TRUE) 39.9=VLOOKUP(H43.$H$7:$I$56.2,TRUE) 40.9=VLOOKUP(H44.$H$7:$I$56.2,TRUE) 40.3 =VLOOKUP(H45.$H$7:$I$56,2,TRUE) 40.1 =VLOOKUP(H46.$H$7:$I$56,2,TRUE) 37.6 =VLOOKUP(H47.$H$7:$I$56.2.TRUE) 39.1 =VLOOKUP(H48.$H$7:$I$56.2,TRUE) 35.2 =VLOOKUP(H49.$H$7:$I$56,2,TRUE) 31.5=VLOOKUP(H50.$H$7:$I$56.2,TRUE) 43 VLOOKUP(H51.$H$7:$I$56,2,TRUE) 38.7=VLOOKUP(H52.$H$7:$I$56.2.TRUE) 37.9=VLOOKUP(H53.$H$7:$I$56.2,TRUE) 43 =VLOOKUP(H54.$H$7:$I$56,2,TRUE) 40=VLOOKUP(H55.$H$7:$I$56,2,TRUE)
Expert Answer:

Related Book For 

Income Tax Fundamentals 2013
ISBN: 9781285586618
31st Edition
Authors: Gerald E. Whittenburg, Martha Altus Buller, Steven L Gill
Posted Date:
Students also viewed these marketing questions
-
1. help me summarize the text below, also help me find 3 research findings The U.S. population is undergoing rapid racial and ethnic change, led by growth of the Hispanic/Latino and Asian American...
-
The following additional information is available for the Dr. Ivan and Irene Incisor family from Chapters 1-5. Ivan's grandfather died and left a portfolio of municipal bonds. In 2012, they pay Ivan...
-
Draw a topology on paper that will show the connection between home network and College (LAN) using conventional symbols used in networking? (10) Home Network: 1 connecting device 1 Wireless devices...
-
The temperatures indoors and outdoors are 299 and 312 K, respectively. A Carnot air conditioner deposits 6.12 105 J of heat outdoors. How much heat is removed from the house?
-
Data Set 17 "Course Evaluations" in Appendix B includes data from student evaluations of courses. The summary statistics are n = 93, x = 3.91, s = 0.53. Use a 0.05 significance level to test the...
-
Briefly describe the three phases of the World Wide Webs development.
-
Hinshaw Company purchased a new machine on October 1, 2014, at a cost of $90,000. The company estimated that the machine has a salvage value of $8,000. The machine is expected to be used for 70,000...
-
1. Explain the objective of the capital asset pricing model 2. Explain the objective of the calculation of the break-even level per units/ revenues 3. When would you use the divisional WACC instead...
-
you will be implementing a class which acts as a dynamically-sized integer array. When the object is instantiated, it will allocate a dynamic array of integers with the given capacity. 1. Declare and...
-
Paul corporation of profit, maximizing monopoly. It sells a patented rabies vaccine for pets and earns economic profits.
-
here are 4 common categories of customers: new, existing, exiting, and exited. Suppose you work for a large financial institution that is looking to improve its savings deposits and retirement...
-
Q. Today, social, mobile, and local marketing are the fastest-growing forms of online marketing. This assignment is to plan your own business. A. Describe its business model mentioning the comparison...
-
what ways does inspiration intersect with motivation and drive, propelling individuals towards extraordinary feats of accomplishment ? Explain
-
How does inspiration catalyze the process of creativity, particularly in the realms of art and innovation ?
-
On 1 January 20X3, Highmark Corp. had the following deferred tax balances: Deferred income tax asset related to warranty $ 17,000 Deferred income tax liability related to capital assets $ 122,000 On...
-
Select a mass spectrometric technique with the highest mass resolution for identifying an unknown compound being eluted from a liquid chromatography column
-
Your supervisor has asked you to research the following situation concerning Owen and Lisa Cordoncillo. Owen and Lisa are brother and sister. In May 2012, Owen and Lisa exchange business pickup...
-
During 2012, Palo Fiero purchases the following property for use in his manufacturing business: Palo uses the accelerated depreciation method under MACRS, if available, and does not make the election...
-
Leslie and Leon Lazo are married and file a joint return for 2012. Leslie's Social Security number is 466-47-3311 and Leon's is 467-74-4451. They live at 143 Snapdragon Drive, Reno, NV 82102. For...
-
Describe the principle parts of a lathe with a neat sketch.
-
How a lathe is specified? Explain with a neat diagram.
-
How do you classify a lathe? Explain briefly.

Study smarter with the SolutionInn App