

Question: Questions 1. Examine the basic summary statistics of key variables in the dataset: a. How many firms are contained in the dataset without missing observations?
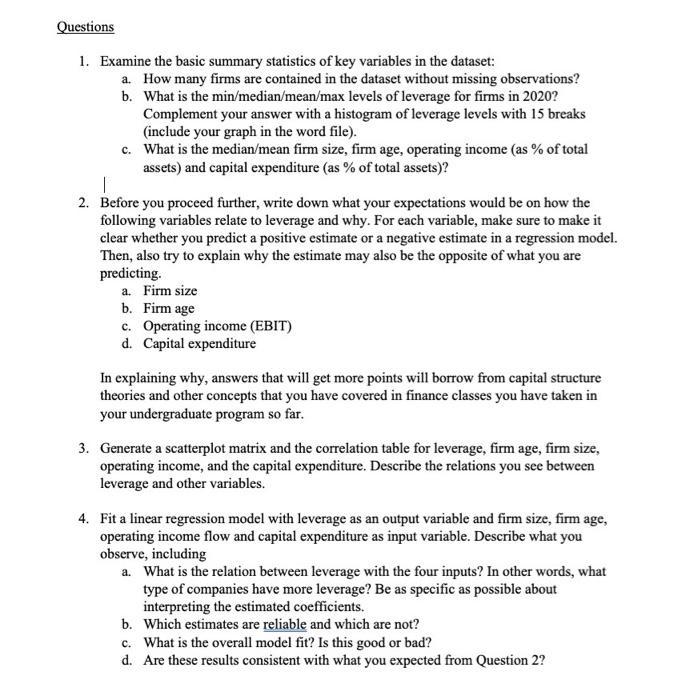
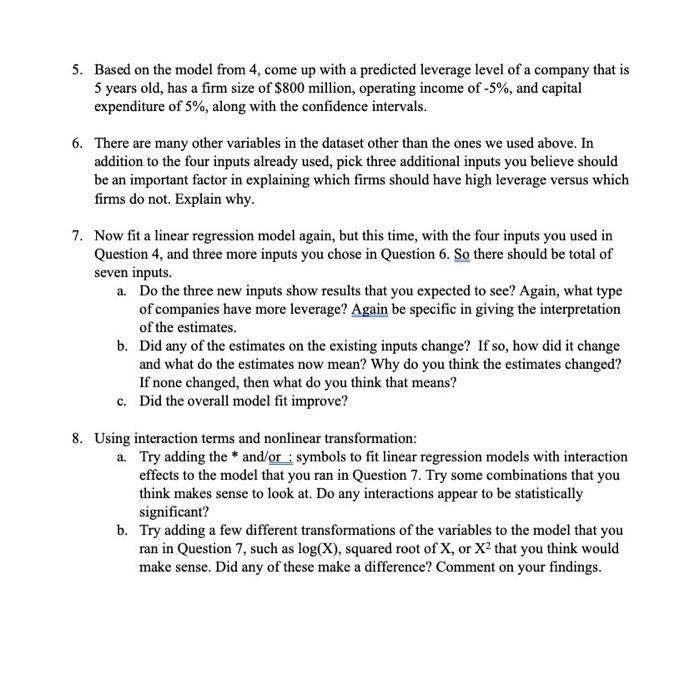
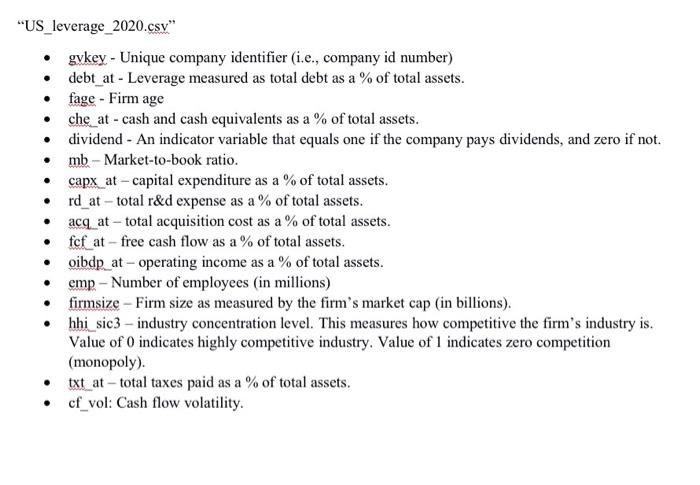
Questions 1. Examine the basic summary statistics of key variables in the dataset: a. How many firms are contained in the dataset without missing observations? b. What is the min/median/mean/max levels of leverage for firms in 2020? Complement your answer with a histogram of leverage levels with 15 breaks (include your graph in the word file). c. What is the median/mean firm size, firm age, operating income (as % of total assets) and capital expenditure (as % of total assets)? | 2. Before you proceed further, write down what your expectations would be on how the following variables relate to leverage and why. For each variable, make sure to make it clear whether you predict a positive estimate or a negative estimate in a regression model. Then, also try to explain why the estimate may also be the opposite of what you are predicting. a. Firm size b. Firm age c. Operating income (EBIT) d. Capital expenditure In explaining why, answers that will get more points will borrow from capital structure theories and other concepts that you have covered in finance classes you have taken in your undergraduate program so far. 3. Generate a scatterplot matrix and the correlation table for leverage, firm age, firm size, operating income, and the capital expenditure. Describe the relations you see between leverage and other variables. 4. Fit a linear regression model with leverage as an output variable and firm size, firm age, operating income flow and capital expenditure as input variable. Describe what you observe, including a. What is the relation between leverage with the four inputs? In other words, what type of companies have more leverage? Be as specific as possible about interpreting the estimated coefficients. b. Which estimates are reliable and which are not? c. What is the overall model fit? Is this good or bad? d. Are these results consistent with what you expected from Question 2? 5. Based on the model from 4, come up with a predicted leverage level of a company that is 5 years old, has a firm size of $800 million, operating income of -5%, and capital expenditure of 5%, along with the confidence intervals. 6. There are many other variables in the dataset other than the ones we used above. In addition to the four inputs already used, pick three additional inputs you believe should be an important factor in explaining which firms should have high leverage versus which firms do not. Explain why. 7. Now fit a linear regression model again, but this time, with the four inputs you used in Question 4, and three more inputs you chose in Question 6. So there should be total of seven inputs. a. Do the three new inputs show results that you expected to see? Again, what type of companies have more leverage? Again be specific in giving the interpretation of the estimates. b. Did any of the estimates on the existing inputs change? If so, how did it change and what do the estimates now mean? Why do you think the estimates changed? If none changed, then what do you think that means? c. Did the overall model fit improve? 8. Using interaction terms and nonlinear transformation: a. Try adding the * and/or : symbols to fit linear regression models with interaction effects to the model that you ran in Question 7. Try some combinations that you think makes sense to look at. Do any interactions appear to be statistically significant? b. Try adding a few different transformations of the variables to the model that you ran in Question 7, such as log(X), squared root of X, or X2 that you think would make sense. Did any of these make a difference? Comment on your findings. . . "US_leverage_2020.csy" gykey - Unique company identifier (i.e., company id number) debt_at - Leverage measured as total debt as a % of total assets. fage - Firm age che_at - cash and cash equivalents as a % of total assets. dividend - An indicator variable that equals one if the company pays dividends, and zero if not. mb - Market-to-book ratio. capxat - capital expenditure as a % of total assets. rd_at - total r&d expense as a % of total assets. acq at - total acquisition cost as a % of total assets. fcf_at - free cash flow as a % of total assets. oibdp_at - operating income as a % of total assets. emp- Number of employees (in millions) firmsize - Firm size as measured by the firm's market cap (in billions). hhi sic3 - industry concentration level. This measures how competitive the firm's industry is. Value of 0 indicates highly competitive industry. Value of 1 indicates zero competition (monopoly). txt_at - total taxes paid as a % of total assets. cf_vol: Cash flow volatility. . . Questions 1. Examine the basic summary statistics of key variables in the dataset: a. How many firms are contained in the dataset without missing observations? b. What is the min/median/mean/max levels of leverage for firms in 2020? Complement your answer with a histogram of leverage levels with 15 breaks (include your graph in the word file). c. What is the median/mean firm size, firm age, operating income (as % of total assets) and capital expenditure (as % of total assets)? | 2. Before you proceed further, write down what your expectations would be on how the following variables relate to leverage and why. For each variable, make sure to make it clear whether you predict a positive estimate or a negative estimate in a regression model. Then, also try to explain why the estimate may also be the opposite of what you are predicting. a. Firm size b. Firm age c. Operating income (EBIT) d. Capital expenditure In explaining why, answers that will get more points will borrow from capital structure theories and other concepts that you have covered in finance classes you have taken in your undergraduate program so far. 3. Generate a scatterplot matrix and the correlation table for leverage, firm age, firm size, operating income, and the capital expenditure. Describe the relations you see between leverage and other variables. 4. Fit a linear regression model with leverage as an output variable and firm size, firm age, operating income flow and capital expenditure as input variable. Describe what you observe, including a. What is the relation between leverage with the four inputs? In other words, what type of companies have more leverage? Be as specific as possible about interpreting the estimated coefficients. b. Which estimates are reliable and which are not? c. What is the overall model fit? Is this good or bad? d. Are these results consistent with what you expected from Question 2? 5. Based on the model from 4, come up with a predicted leverage level of a company that is 5 years old, has a firm size of $800 million, operating income of -5%, and capital expenditure of 5%, along with the confidence intervals. 6. There are many other variables in the dataset other than the ones we used above. In addition to the four inputs already used, pick three additional inputs you believe should be an important factor in explaining which firms should have high leverage versus which firms do not. Explain why. 7. Now fit a linear regression model again, but this time, with the four inputs you used in Question 4, and three more inputs you chose in Question 6. So there should be total of seven inputs. a. Do the three new inputs show results that you expected to see? Again, what type of companies have more leverage? Again be specific in giving the interpretation of the estimates. b. Did any of the estimates on the existing inputs change? If so, how did it change and what do the estimates now mean? Why do you think the estimates changed? If none changed, then what do you think that means? c. Did the overall model fit improve? 8. Using interaction terms and nonlinear transformation: a. Try adding the * and/or : symbols to fit linear regression models with interaction effects to the model that you ran in Question 7. Try some combinations that you think makes sense to look at. Do any interactions appear to be statistically significant? b. Try adding a few different transformations of the variables to the model that you ran in Question 7, such as log(X), squared root of X, or X2 that you think would make sense. Did any of these make a difference? Comment on your findings. . . "US_leverage_2020.csy" gykey - Unique company identifier (i.e., company id number) debt_at - Leverage measured as total debt as a % of total assets. fage - Firm age che_at - cash and cash equivalents as a % of total assets. dividend - An indicator variable that equals one if the company pays dividends, and zero if not. mb - Market-to-book ratio. capxat - capital expenditure as a % of total assets. rd_at - total r&d expense as a % of total assets. acq at - total acquisition cost as a % of total assets. fcf_at - free cash flow as a % of total assets. oibdp_at - operating income as a % of total assets. emp- Number of employees (in millions) firmsize - Firm size as measured by the firm's market cap (in billions). hhi sic3 - industry concentration level. This measures how competitive the firm's industry is. Value of 0 indicates highly competitive industry. Value of 1 indicates zero competition (monopoly). txt_at - total taxes paid as a % of total assets. cf_vol: Cash flow volatility
Step by Step Solution
There are 3 Steps involved in it

Get step-by-step solutions from verified subject matter experts