

Question: Questions- 1. You are given a simulated data file named 'sales.xls' that contains sales for two divisions. Sheet 'Price' contains prices and costs (in dollars)
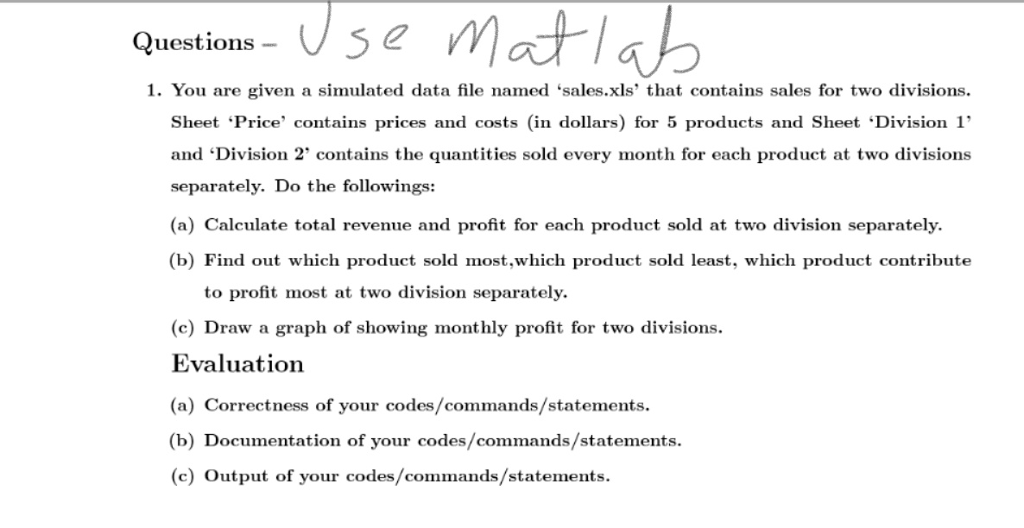
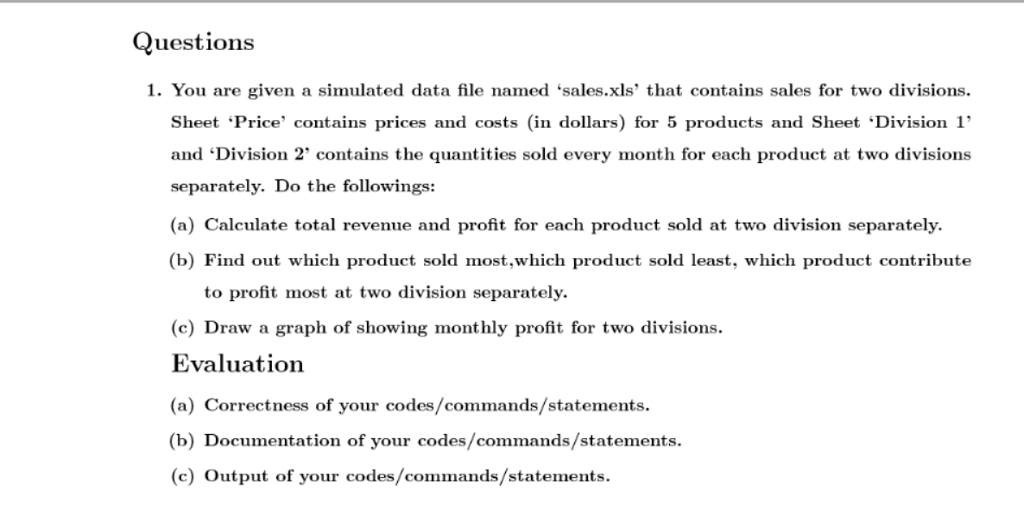
Questions- 1. You are given a simulated data file named 'sales.xls' that contains sales for two divisions. Sheet 'Price' contains prices and costs (in dollars) for 5 products and Sheet 'Division 1' and 'Division 2" contains the quantities sold every month for each product at two divisions separately. Do the followings: (a) Calculate total revenue and profit for each product sold at two division separately. (b) Find out which product sold most,which product sold least, which product contribute to profit most at two division separately. (c) Draw a graph of showing monthly profit for two divisions Evaluation (a) Correctness of your codes/commands/statements. (b) Documentation of your codes/commands/statements. (c) Output of your codes/commands/statements Questions 1. You are given a simulated data file named 'sales.xls' that contains sales for two divisions. Sheet 'Price' contains prices and costs (in dollars) for 5 products and Sheet 'Division 1' and 'Division 2" contains the quantities sold every month for each product at two divisions separately. Do the followings: (a) Calculate total revenue and profit for each product sold at two division separately. b) Find out which product sold most,which product sold least, which product contribute to profit most at two division separately. (c) Draw a graph of showing monthly profit for two divisions Evaluation (a) Correctness of your codes/commands/statements. Documentation of your codes/commands/statements. (c) Output of your codes/commands/statements Questions- 1. You are given a simulated data file named 'sales.xls' that contains sales for two divisions. Sheet 'Price' contains prices and costs (in dollars) for 5 products and Sheet 'Division 1' and 'Division 2" contains the quantities sold every month for each product at two divisions separately. Do the followings: (a) Calculate total revenue and profit for each product sold at two division separately. (b) Find out which product sold most,which product sold least, which product contribute to profit most at two division separately. (c) Draw a graph of showing monthly profit for two divisions Evaluation (a) Correctness of your codes/commands/statements. (b) Documentation of your codes/commands/statements. (c) Output of your codes/commands/statements Questions 1. You are given a simulated data file named 'sales.xls' that contains sales for two divisions. Sheet 'Price' contains prices and costs (in dollars) for 5 products and Sheet 'Division 1' and 'Division 2" contains the quantities sold every month for each product at two divisions separately. Do the followings: (a) Calculate total revenue and profit for each product sold at two division separately. b) Find out which product sold most,which product sold least, which product contribute to profit most at two division separately. (c) Draw a graph of showing monthly profit for two divisions Evaluation (a) Correctness of your codes/commands/statements. Documentation of your codes/commands/statements. (c) Output of your codes/commands/statements
Step by Step Solution
There are 3 Steps involved in it

Get step-by-step solutions from verified subject matter experts