

Question: questions 10 and 11 eBook Submit Answer 10. [-/3 Points] DETAILS SPRECALC7 2.4.036. MY NOTES The graph gives the number of farms in the United
questions 10 and 11
![questions 10 and 11 eBook Submit Answer 10. [-/3 Points] DETAILS SPRECALC7](https://dsd5zvtm8ll6.cloudfront.net/si.experts.images/questions/2024/10/6713bc350cd40_6126713bc34e0fb2.jpg)
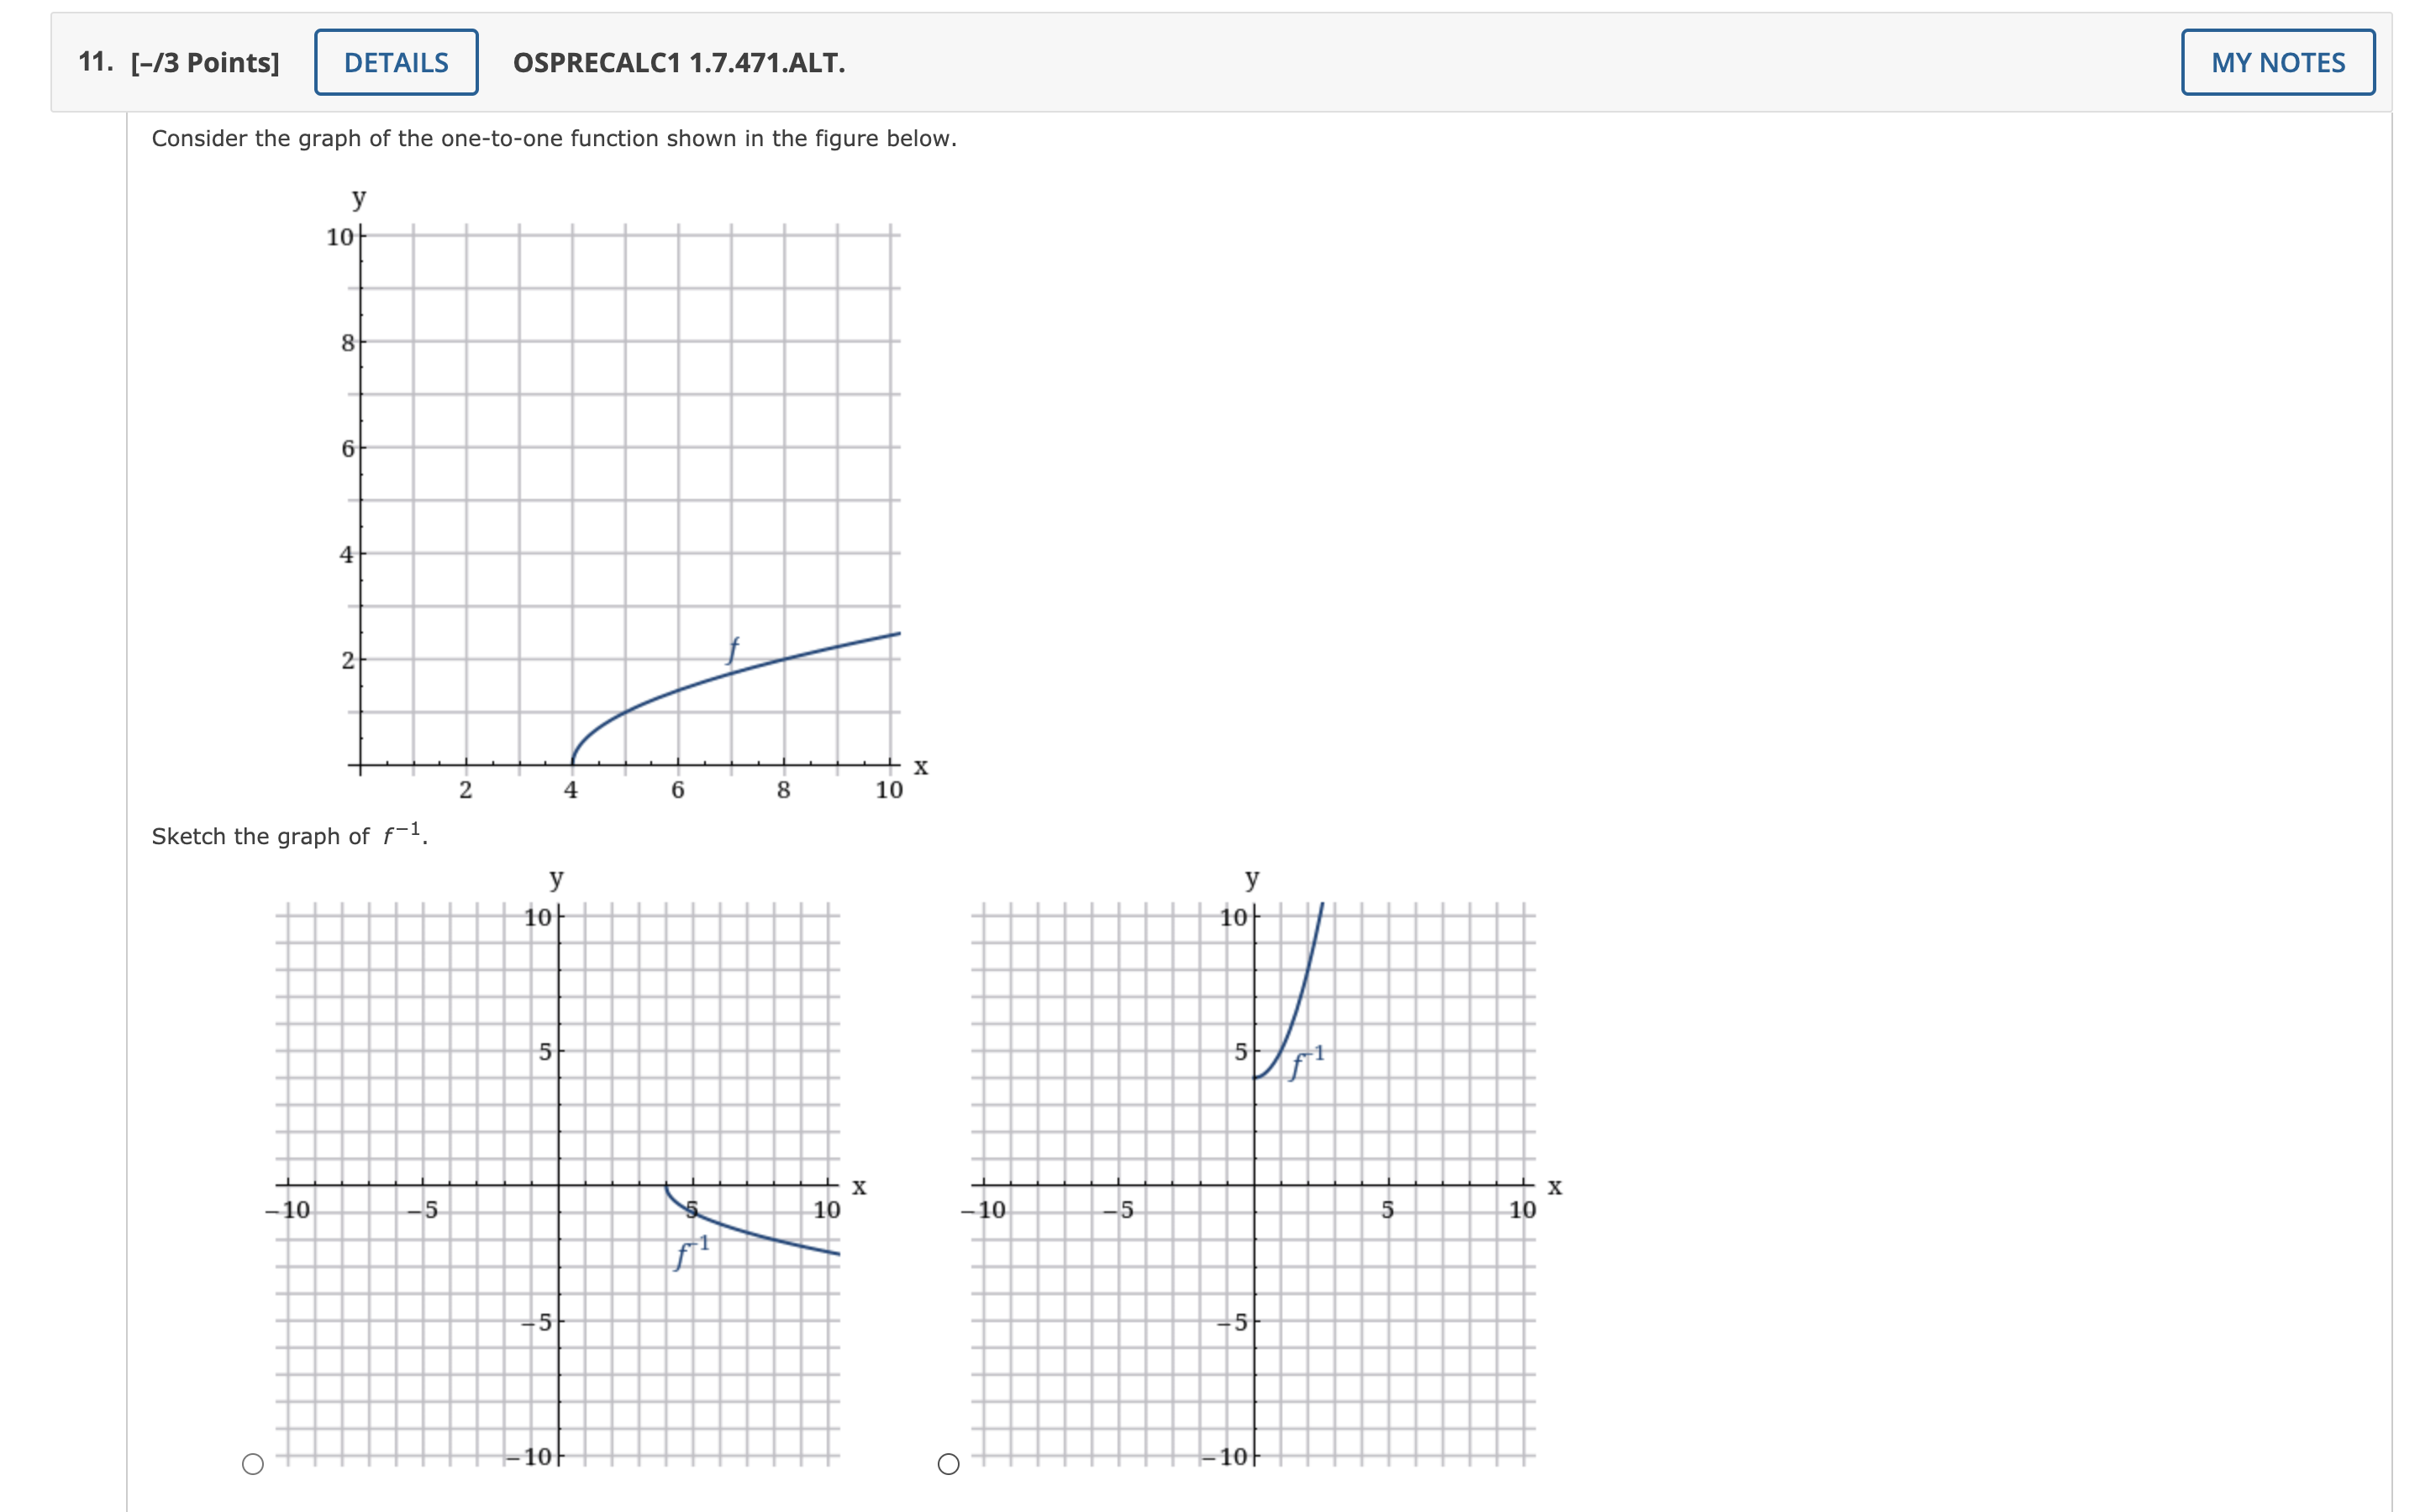
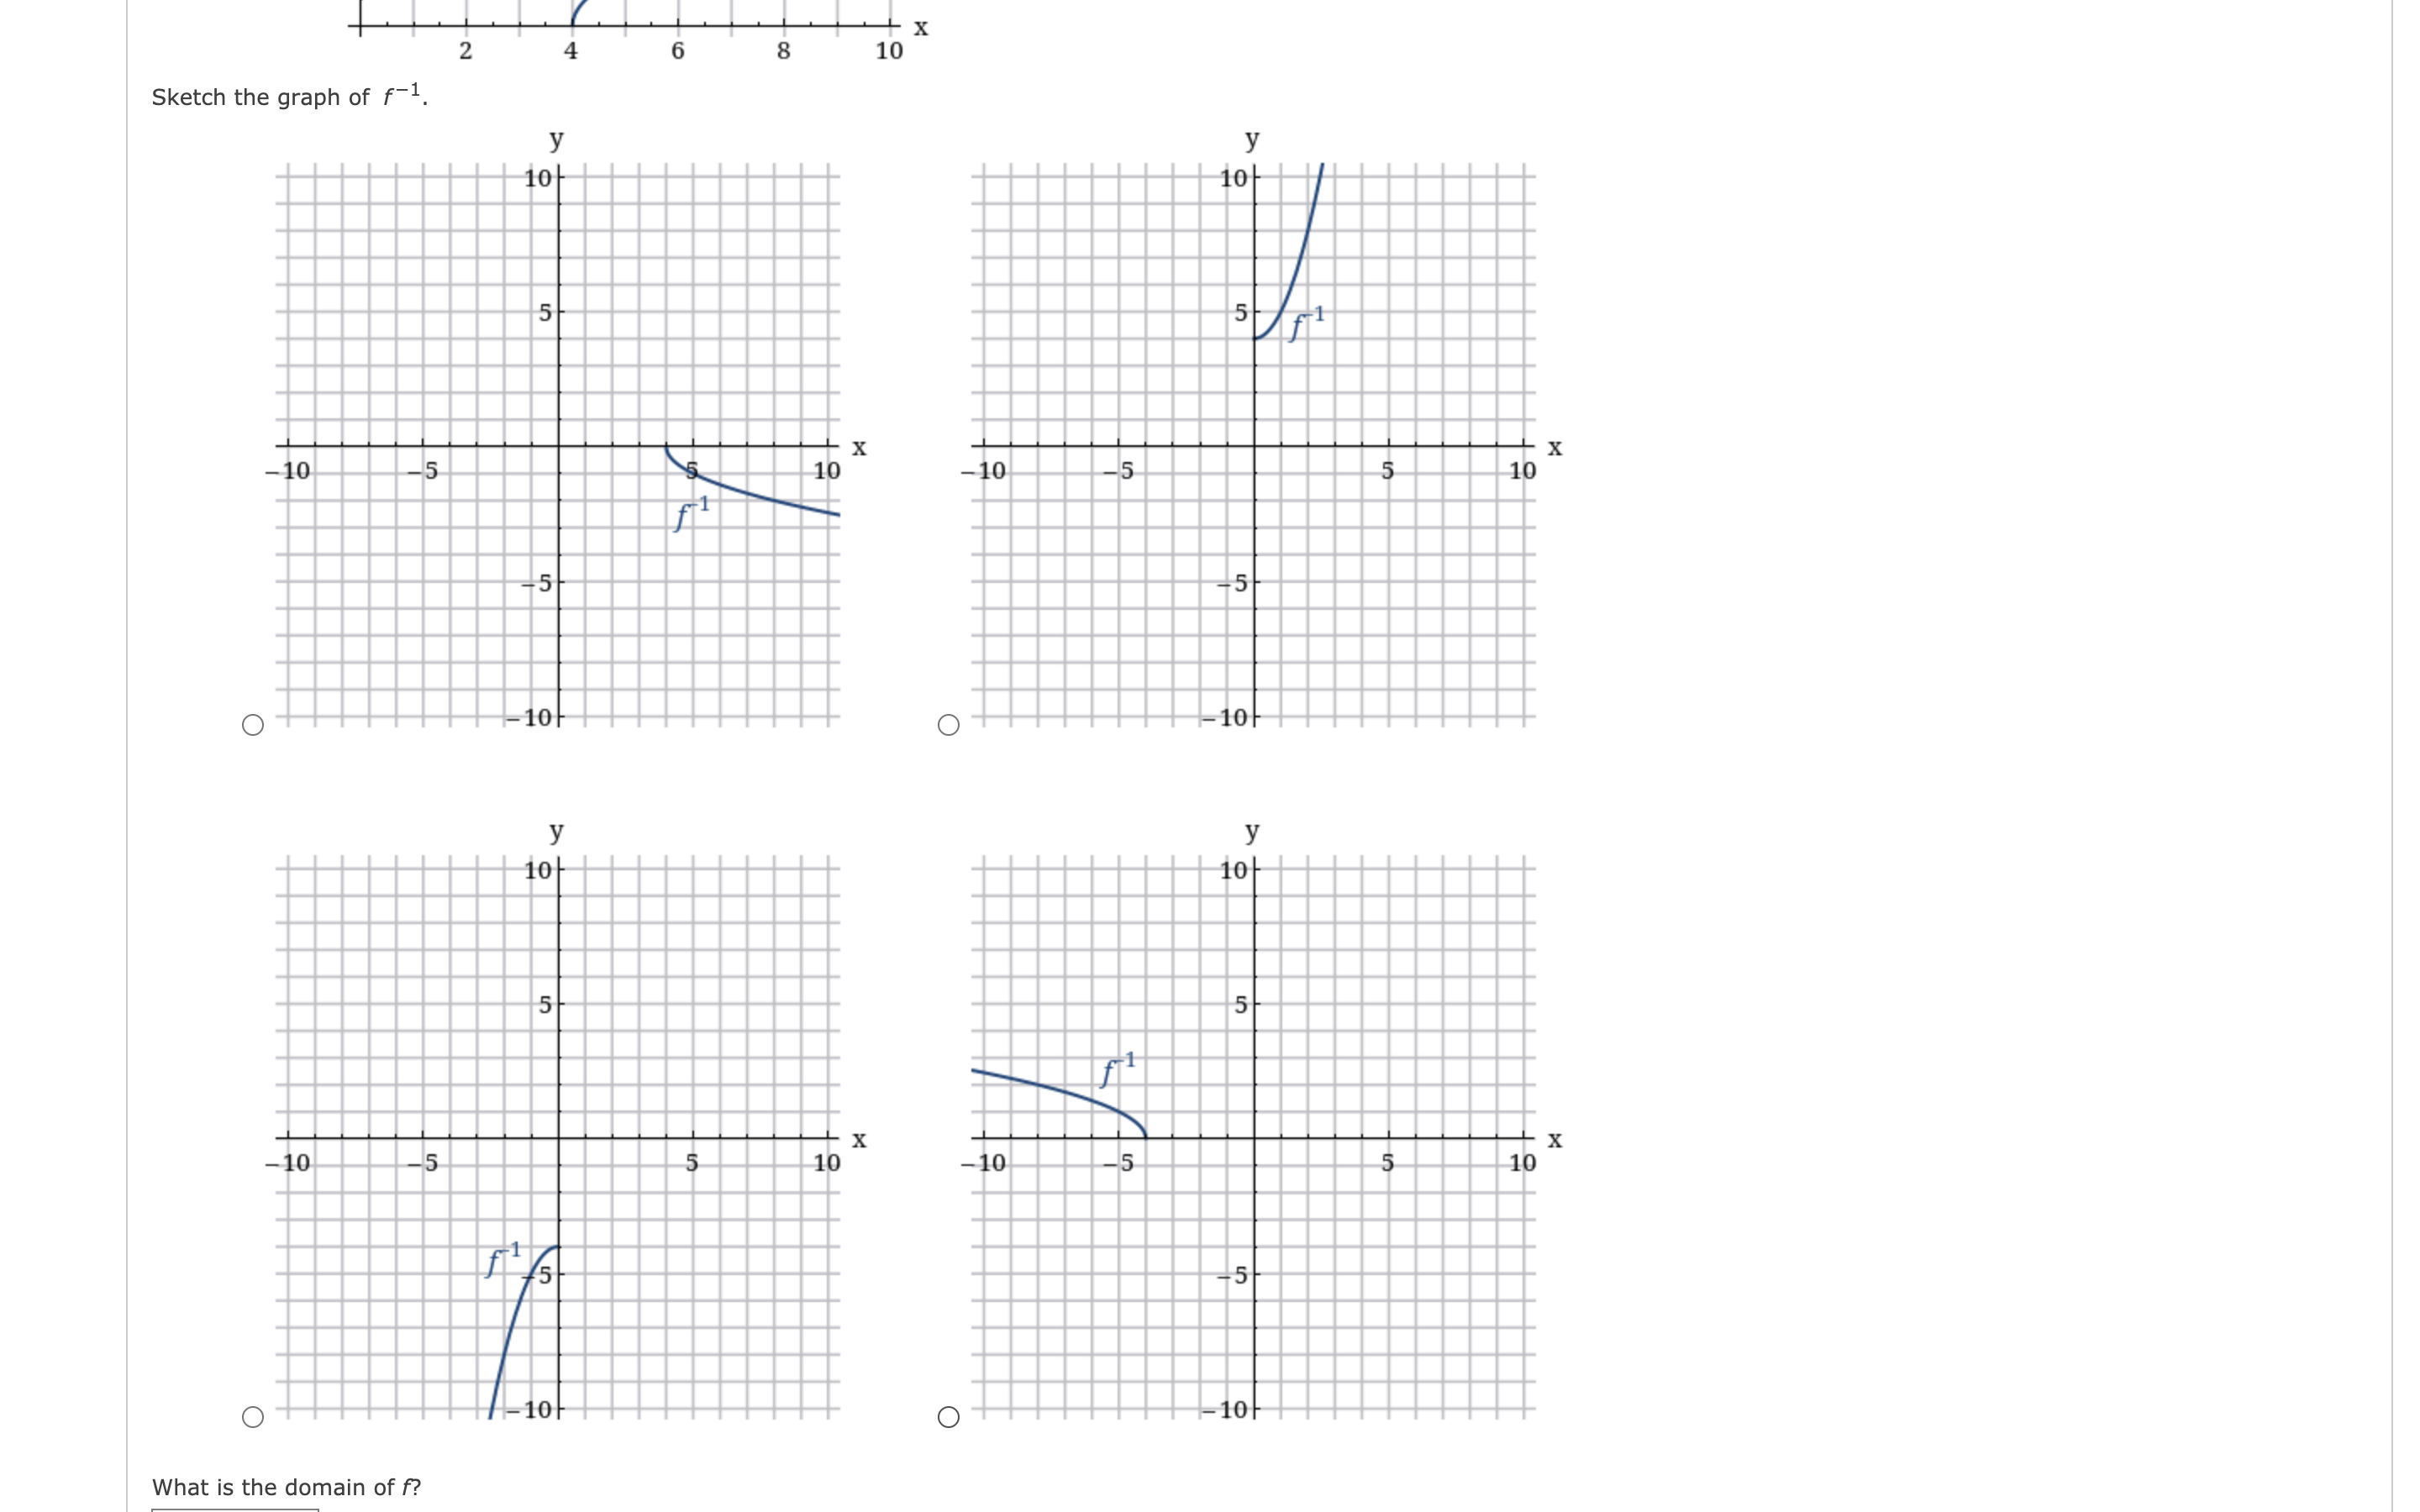
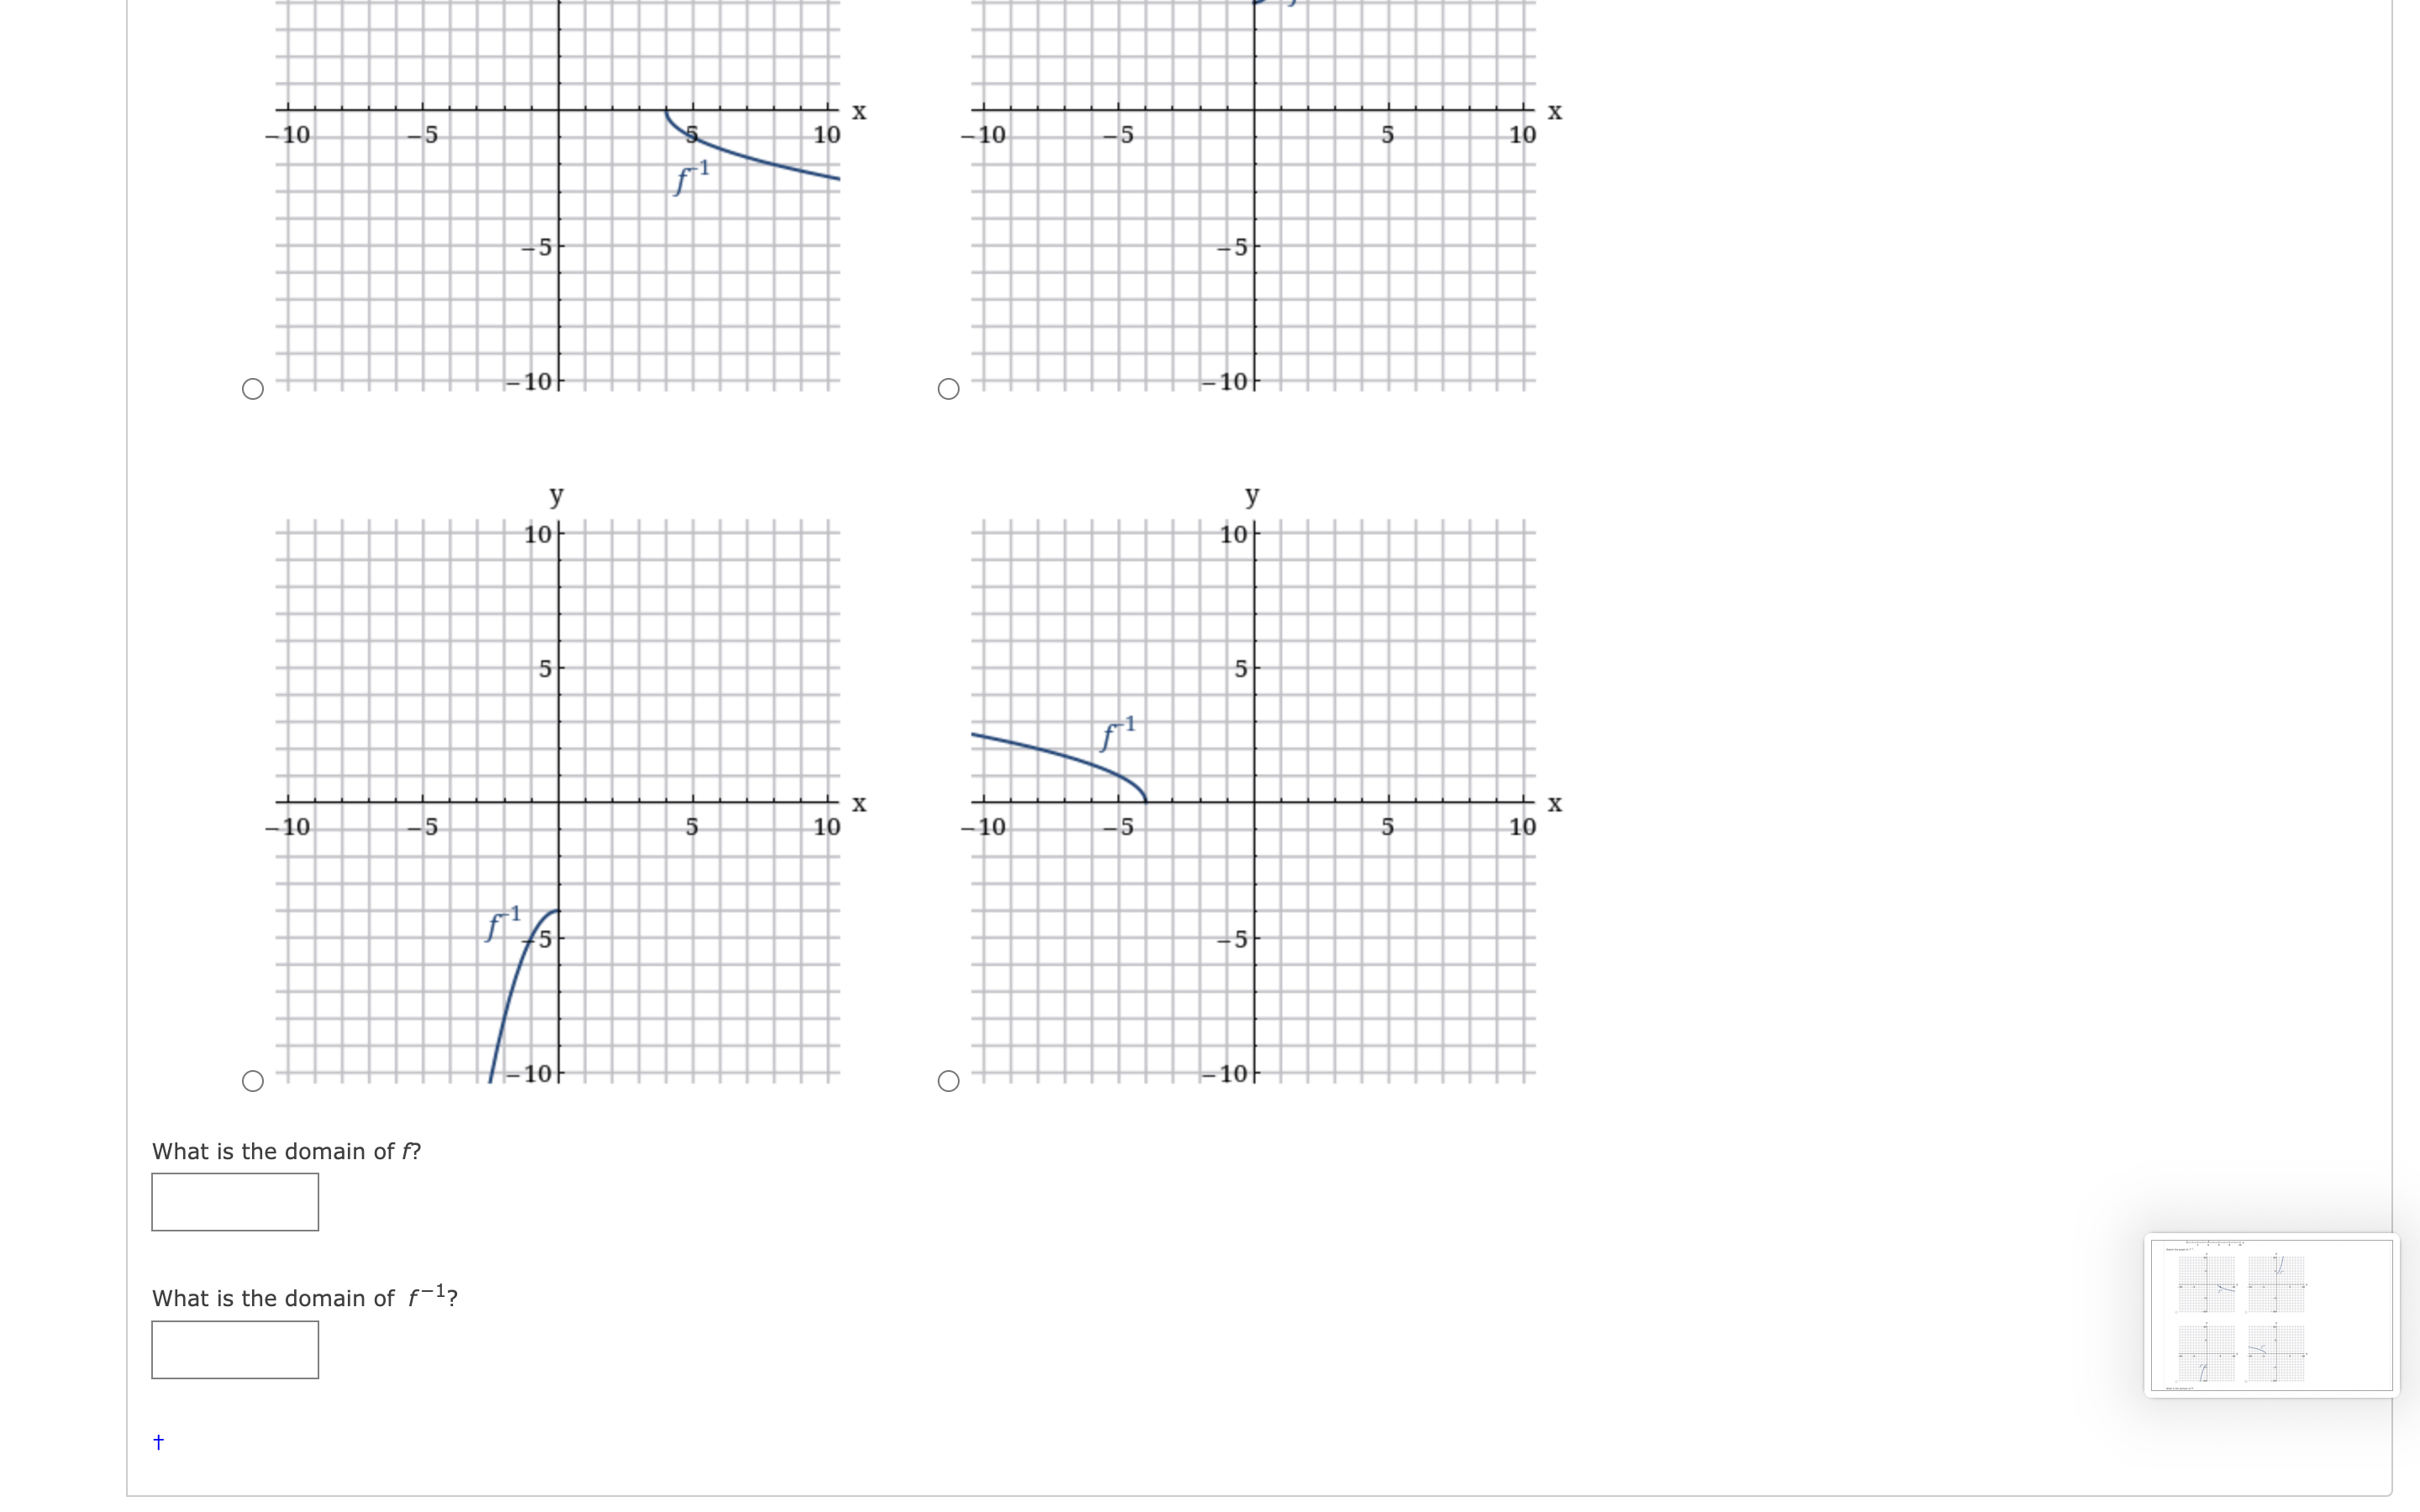
eBook Submit Answer 10. [-/3 Points] DETAILS SPRECALC7 2.4.036. MY NOTES The graph gives the number of farms in the United States from 1850 to 2000. 7000 6000 5000 4000 3000 2000 1000 1860 1900 1940 1980 (a) Estimate the average rate of change in the number of farms between 1860 and 1920 and between 1950 and 2000. (Round your answers to the nearest whole number). 1860 and 1920 farms per year 1950 and 2000 farms per year (b) In which decade did the number of farms experience the greatest average rate of decline? 1870 - 1880 1910 - 1920 1940 - 1950 1950 - 1960 1960 - 1970 11. [-/3 Points] DETAILS OSPRECALC1 1.7.471.ALT. MY NOTES Consider the graph of the one-to-one function shown in the figure below.11. [-/3 Points] DETAILS OSPRECALC1 1.7.471.ALT. MY NOTES Consider the graph of the onetoone function shown in the gure below. \f\f
Step by Step Solution
There are 3 Steps involved in it

Get step-by-step solutions from verified subject matter experts