

Question: Income Statement As of December 31, Year 2 ($000s) Year 2 Sales 194,299 COGS 103,205 SG&A 54,329 EBIT Interest expense Other income (expenses). net
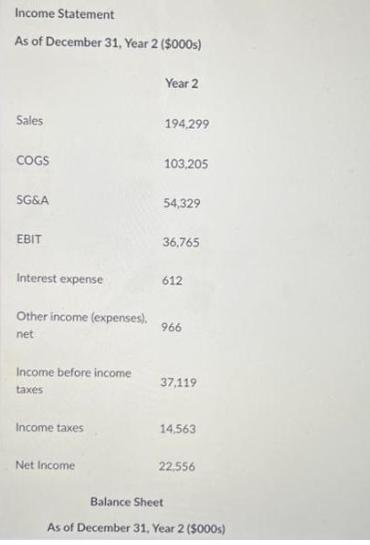
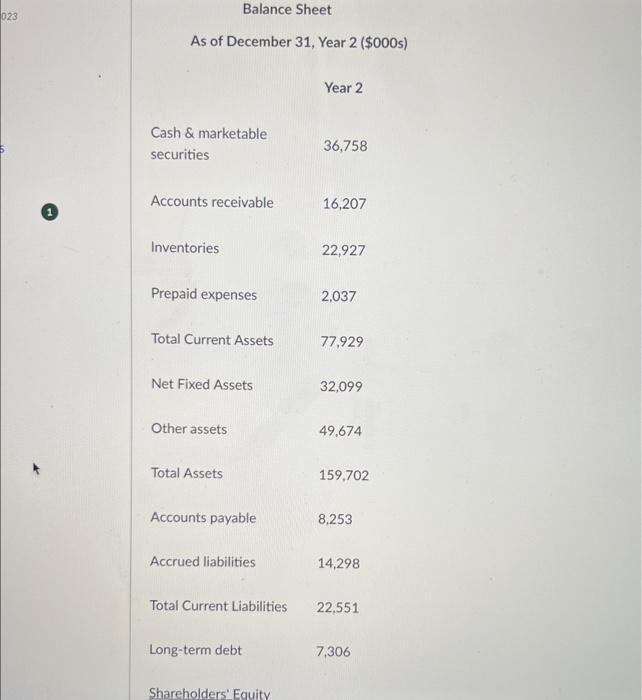
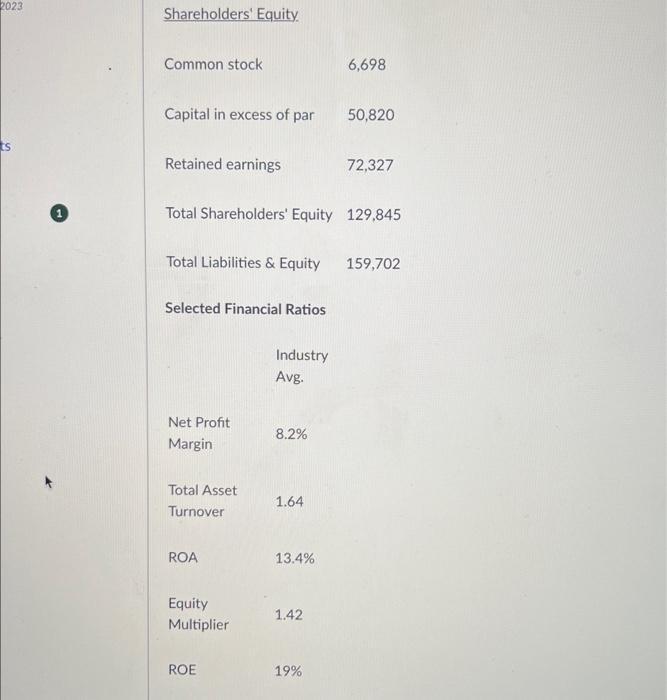
Income Statement As of December 31, Year 2 ($000s) Year 2 Sales 194,299 COGS 103,205 SG&A 54,329 EBIT Interest expense Other income (expenses). net Income before income taxes 36,765 612 966 37,119 Income taxes 14,563 Net Income 22.556 Balance Sheet As of December 31, Year 2 ($000s) 023 Balance Sheet As of December 31, Year 2 ($000s) Year 2 Cash & marketable 36,758 securities Accounts receivable 16,207 Inventories 22,927 Prepaid expenses 2,037 Total Current Assets 77,929 Net Fixed Assets 32,099 Other assets 49,674 Total Assets 159,702 Accounts payable 8,253 Accrued liabilities 14,298 Total Current Liabilities 22,551 Long-term debt 7,306 Shareholders' Equity 2023 ts Shareholders' Equity Common stock 6,698 Capital in excess of par 50,820 Retained earnings 72,327 Total Shareholders' Equity 129,845 Total Liabilities & Equity 159,702 Selected Financial Ratios Industry Avg. Net Profit 8.2% Margin Total Asset 1.64 Turnover ROA 13.4% Equity 1.42 Multiplier ROE 19% Referring to the financial statements for the company and based on the Du Pont analysis, what main reasons explain the difference(s) between the company's ROE and the industry average ROE?
Step by Step Solution
3.31 Rating (154 Votes )
There are 3 Steps involved in it

Get step-by-step solutions from verified subject matter experts