

Question: Questions 1and 2 are together please answer both. 1.Draw a graph plotting temperature vs. volume for perfect separation. For example, if you had an infinite
Questions 1and 2 are together please answer both.
1.Draw a graph plotting temperature vs. volume for perfect separation. For example, if you had an infinite number of theoretical plates.
2.Compare my graph to the graph above.
This is my graph 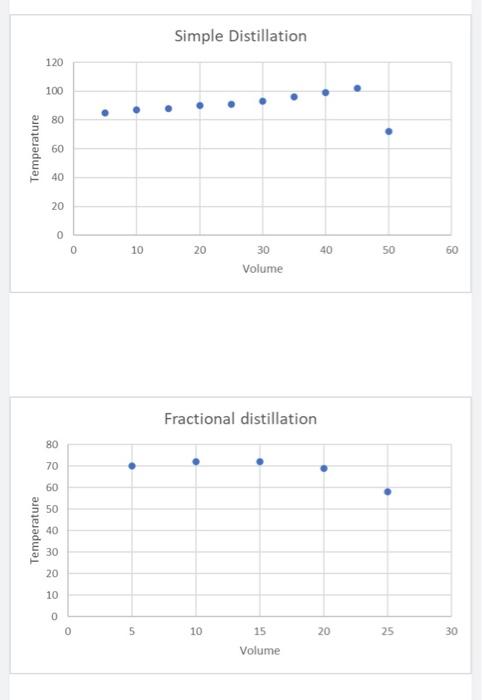
Simple Distillation 120 100 . 80 Temperature 60 40 20 0 0 10 20 40 50 60 30 Volume Fractional distillation 80 70 60 50 Temperature 40 30 20 10 0 0 5 10 15 20 25 30 Volume
Step by Step Solution
There are 3 Steps involved in it
1 Expert Approved Answer
Step: 1 Unlock

Question Has Been Solved by an Expert!
Get step-by-step solutions from verified subject matter experts
Step: 2 Unlock
Step: 3 Unlock