

Question: Questions 24 and 25. Tables provided. 24. 25. Gee Queue The data in Table 12 has been tabulated for every minute of the (60-minute) rush
Questions 24 and 25. Tables provided.
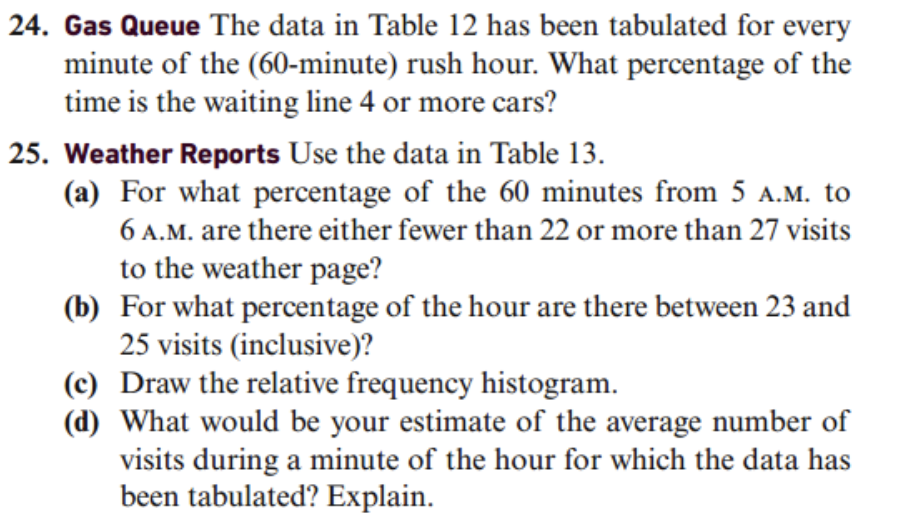
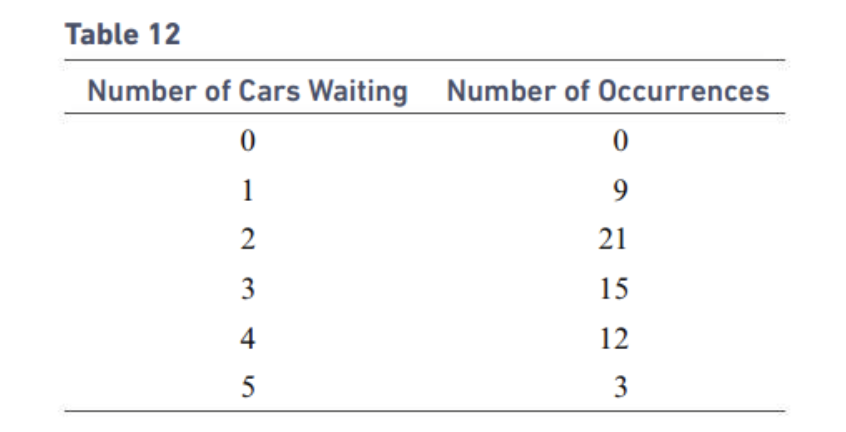
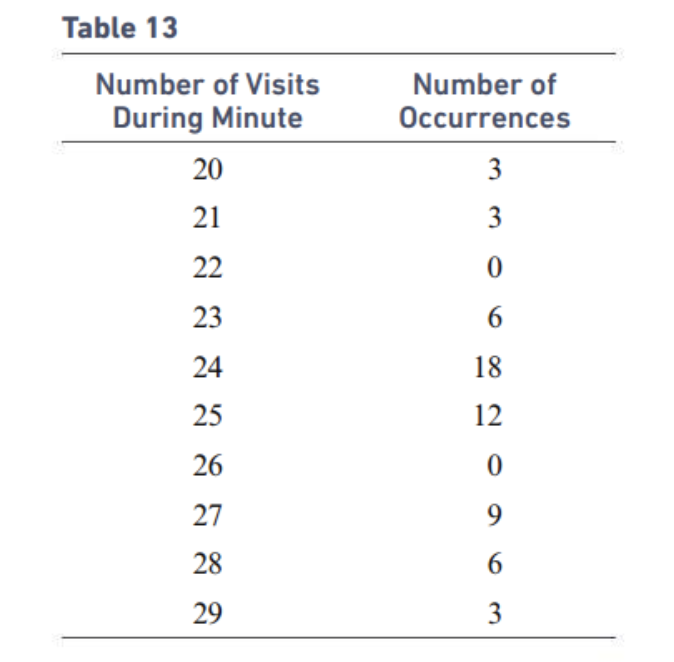
24. 25. Gee Queue The data in Table 12 has been tabulated for every minute of the (60-minute) rush hour. What percentage of the time is the waiting line 4 or more cars? Weather Reports Use the data in Table 13. (a) For what percentage of the 60 minutes from 5 AM. to 6 A.M. are there either fewer than 22 or more than 27 visits to the weather page? (b) For what percentage of the hour are there between 23 and 25 visits (inclusive)? (c) Draw the relative frequency histogram. (d) What would be your estimate of the average number of visits during a minute of the hour for which the data has been tabulated? Explain. Table 12 Number of Cars Waiting Number of Occurrences O UAWNE 15 12 3Table 13 Number of Visits Number of During Minute Occurrences 20 21 a o w w 22 23 24 18 25 26 27 waDOR 28 29
Step by Step Solution
There are 3 Steps involved in it

Get step-by-step solutions from verified subject matter experts