

Question: Questions 3 and 4 please.. CODE IN R NOT PYTHON Question 3: Load the tidyverse library. Download hw4dataset.csv from Brightspace and read it in using
Questions 3 and 4 please.. CODE IN R NOT PYTHON
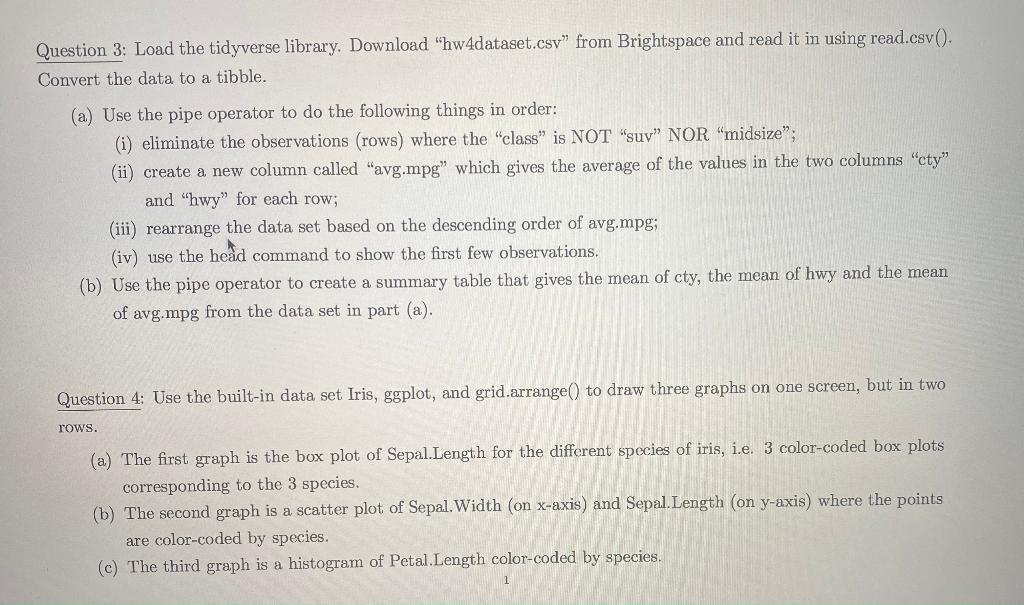
Question 3: Load the tidyverse library. Download "hw4dataset.csv" from Brightspace and read it in using read.csv(). Convert the data to a tibble. (a) Use the pipe operator to do the following things in order: (i) eliminate the observations (rows) where the "class" is NOT "suv" NOR "midsize"; (ii) create a new column called "avg.mpg" which gives the average of the values in the two columns "cty" and "hwy" for each row; (iii) rearrange the data set based on the descending order of avg.mpg; (iv) use the hed command to show the first few observations. (b) Use the pipe operator to create a summary table that gives the mean of cty, the mean of hwy and the mean of avg.mpg from the data set in part (a). Question 4: Use the built-in data set Iris, ggplot, and grid.arrange() to draw three graphs on one screen, but in two rows. (a) The first graph is the box plot of Sepal.Length for the different species of iris, i.e. 3 color-coded box plots corresponding to the 3 species. (b) The second graph is a scatter plot of Sepal.Width (on x-axis) and Sepal.Length (on y-axis) where the points are color-coded by species. (c) The third graph is a histogram of Petal.Length color-coded by species
Step by Step Solution
There are 3 Steps involved in it

Get step-by-step solutions from verified subject matter experts